
Abdalla, M.O. and T.M. Al-Jarrah, 2011. Fuzzy logic control of an electrical traction elevator. Jordan J. Mech. Ind. Eng., 5(1): 97-106.
Research Journal of Applied Sciences, Engineering and Technology
Simulation of Control Elevator Use Fuzzy Logic Method
Research Journal of Applied Sciences, Engineering and Technology 2020 17: 106-114
Cite This ArticleAbstract
Permanent magnet synchronous motor as an actuator for ropeless elevator has several challenges that have to reduce to make the system stable and secure. Detent force as one of a problem for having stabilization system is going to investigate on how its performance under fuzzy logic controller with a nonlinear test such as variations on load and distance to get a policy that can be used for industrial field or other human activities. Preliminary research is presented in this study by making a simulation of control with a fuzzy logic application by Mamdani design and this also aims to compare the previous PI simulation paper. In this fuzzy controller, simulation made with parameters which can cause the existence of detent force such as load, speed, distance, current and power to analyze how the performance under variation situation. With this simulation yield that fuzzy can relatively minimize detent force without considering the impact of saturation or hysteresis on the controller. The simulation is done on 2018 in electrical department of Universitas Indonesia by using the MATLAB R2010a toolbox.
Keywords:
Introduction
Using ropeless elevator as transportation for a very high building which simple in construction and also efficient in time-consuming has to face challenges that many researchers have to conduct more research and development in minimizing detent force. From Selvaperumal et al., (2013) detent force rises because of changing the location of permanent magnet and sloth teeth in a synchronous motor which made vibration and noise appear on the systems.
Several ways used the most to deal with detent force such as by optimizing the structure design and dimension such as skewing which explained on research by Shin et al., (2012), shorten space between slot by Shin et al., (2017). It is only a few types of research that try to deal with detent force without transforming the structure which expensive and time consuming by using controllers. Research from Ainil et al., (2016) has concluded that systems tested with variations value of load, speed and distance without controller produce so many ripples on current and force which makes the system has excellent vibration and noise which will be inconvenient and dangerous. To overcome the problem (Lim and Krishnan 2007) using permanent magnet switched reluctance motor and PI controller on the current has been already succeeded to reduce detent force by using particular load or distance.
To use it on human activities in industrial or daily life, the researcher needs variations on load and distance to test on the system. The investigation on the performance of the system with simulation control is essential to predict the system behavior as basic research for developing a system.
Selvaperumal et al., (2013) has been used fuzzy logic to predict nonlinear situations by using human linguistic terms and also enabled to minimize errors. As seen onresearch by Karim et al., (2008) and Khiang et al., (1999) it does not need an accurate mathematical model, work on imprecise inputs, handle nonlinearity and more robust than PI controller as shown on (Gore and More, 2013) research. They used fuzzy logic controller to control group of elevator mobility and by research from (Patiño-Forero et al., 2012) fuzzy is also used to reduce waiting time, as well as energy distribution and distance based on track research by Ismail and Abdullah (2013) and Abdalla and Al-Jarrah (2011) in this research. Fuzzy logic is used to investigate and predict the behavior of the system with a variation on the parameter’s value. Adding PID with Fuzzy will make the system more efficient in time response for this investigation in controlling stability and performance of detent force in ropeless elevator with a nonlinear value of load and distance.
This study is about making prediction and comparison by simulating the performance of the elevator with Fuzzy and Fuzzy-PID controller for variation of the load to analyze detent force behavior.
Materials And Methods
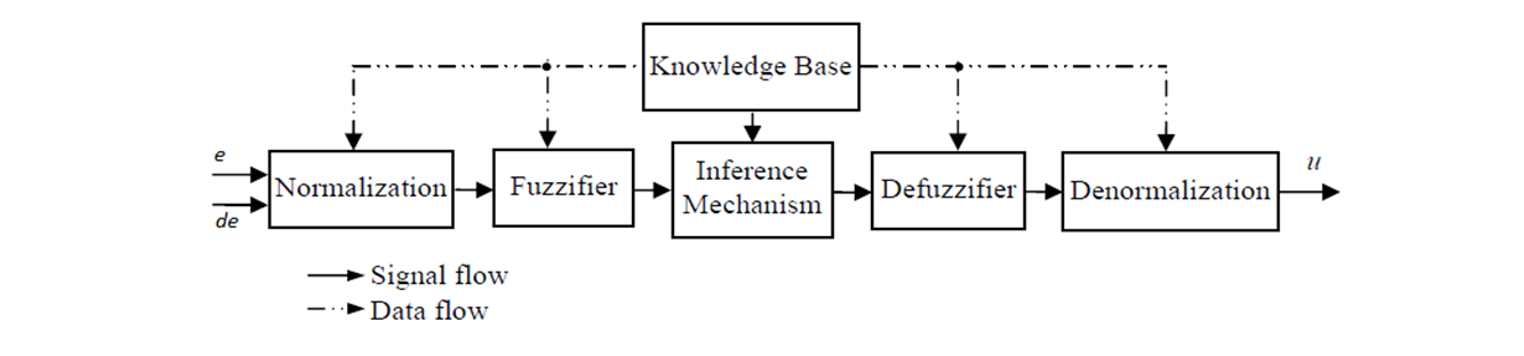
The process of elevator simulations, fuzzy logic serves as a controller in addition to minimize errors that may occur, aswell as quick response, because of the method of calculating the control parameters. As seen in Fig. 1, base on research by Abdalla and Al-Jarrah (2011), there are three stages of fuzzy logic processes: fuzzification stage, inference stage and defuzzification stage.
The first stage of fuzzy control is making fuzzification. The parameter specifications used in these simulations are in Table 1 similar with previous research by Ainil et al., (2016) These parameters are used since the system already tested with no variations input and by using the PI controller on the current system succeed in reducing detent force. Fuzzy rules are made with triangle model then parameter simulation on Table 1 grouped into two outputs to facilitate the calculation process as seen in Table 2.
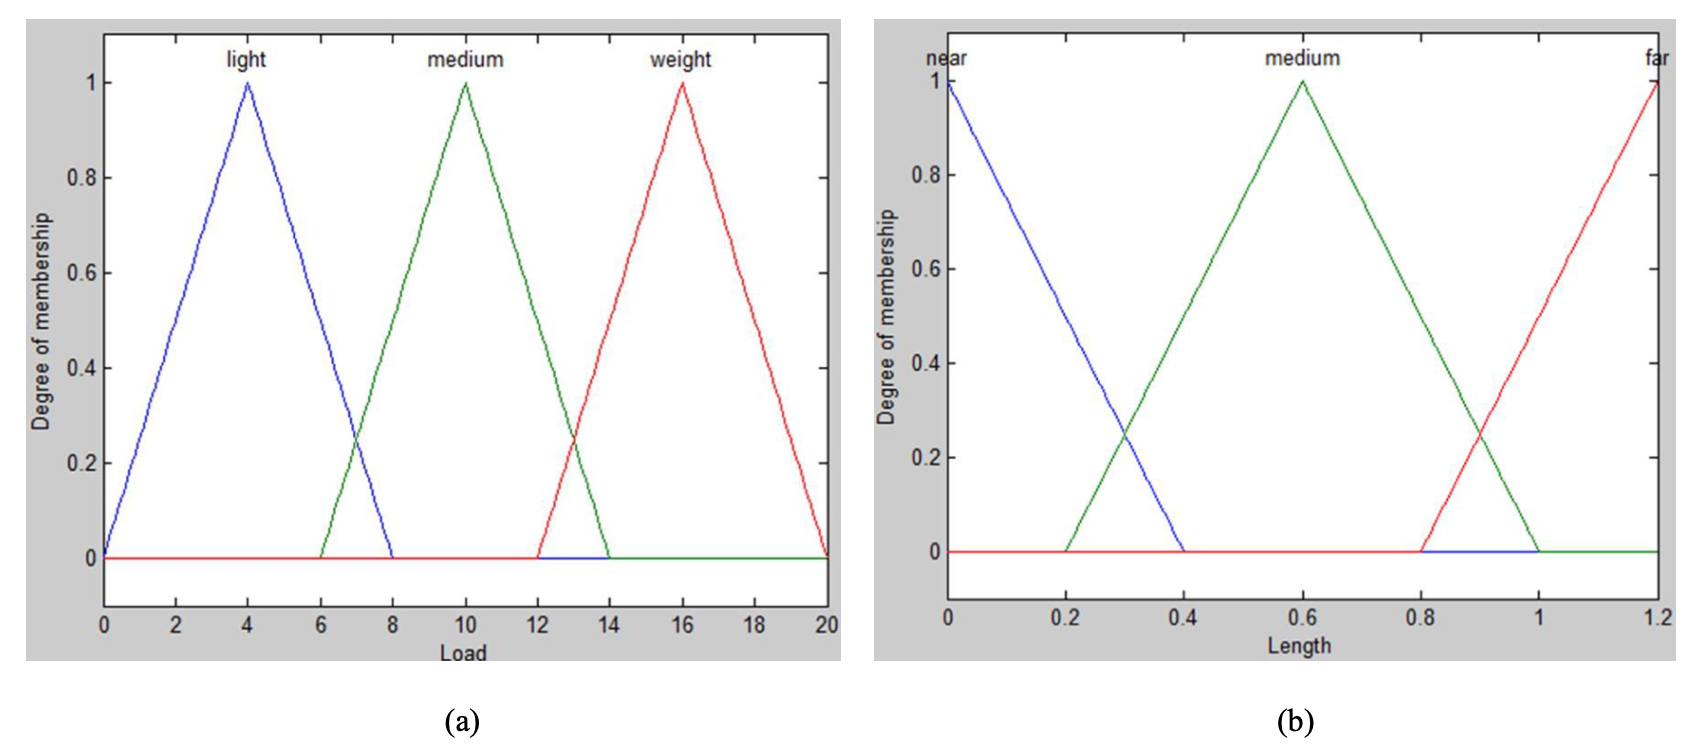
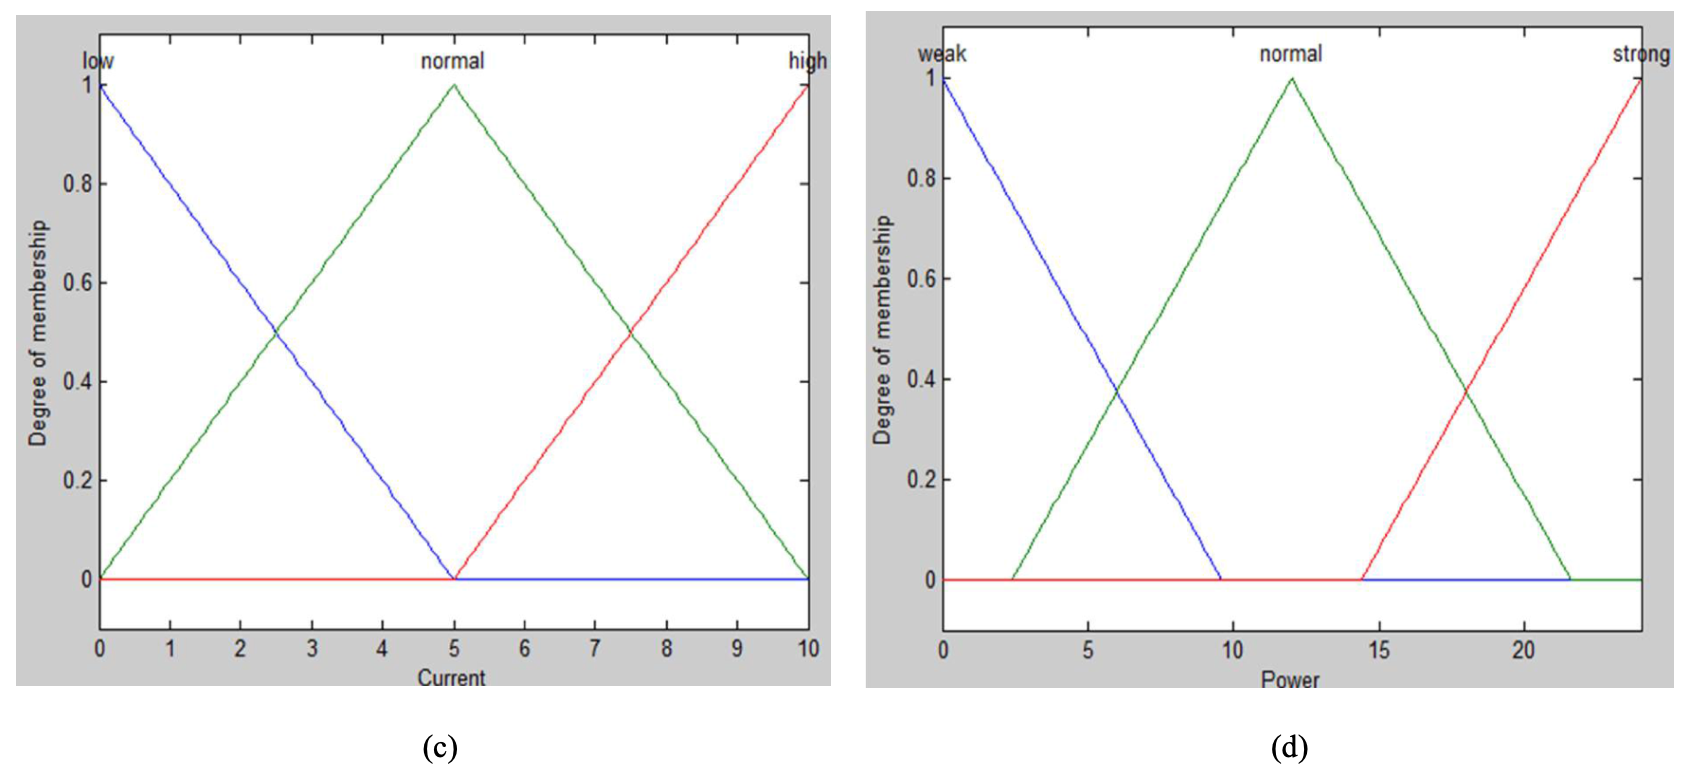
Based on Table 2, the researcher use triangle agent for the linguistic expressions and limit values for each fuzzy appearance to form the membership function for each parameter as seen in Fig. 2
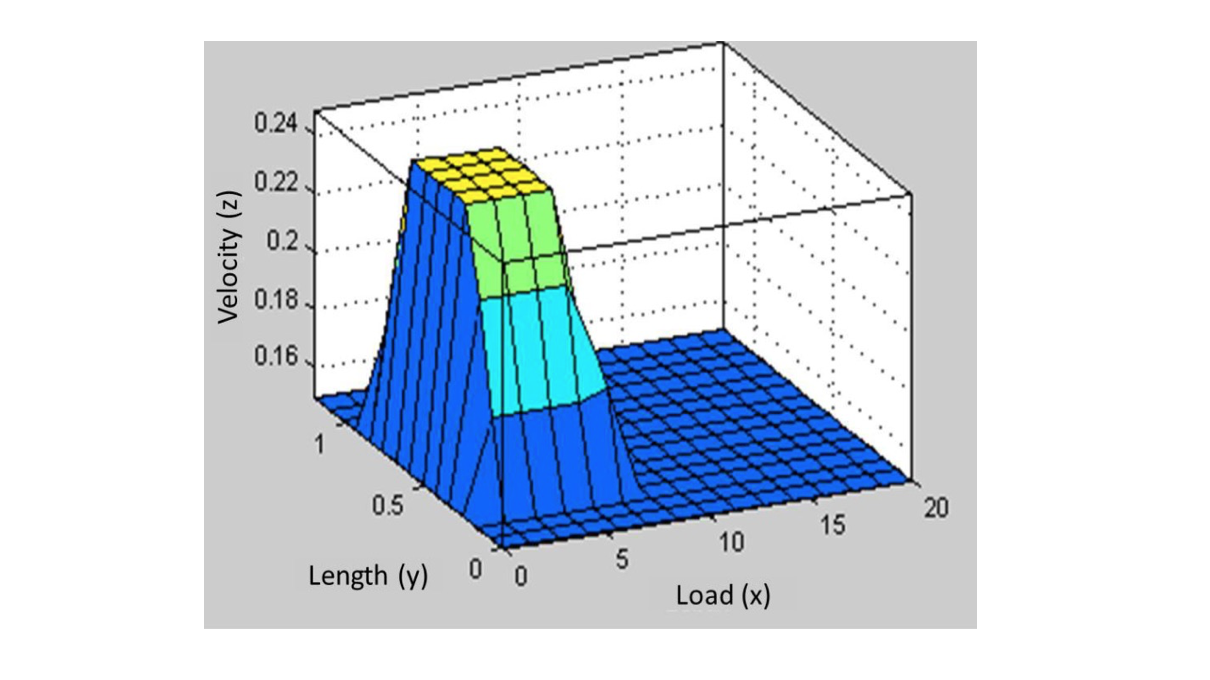
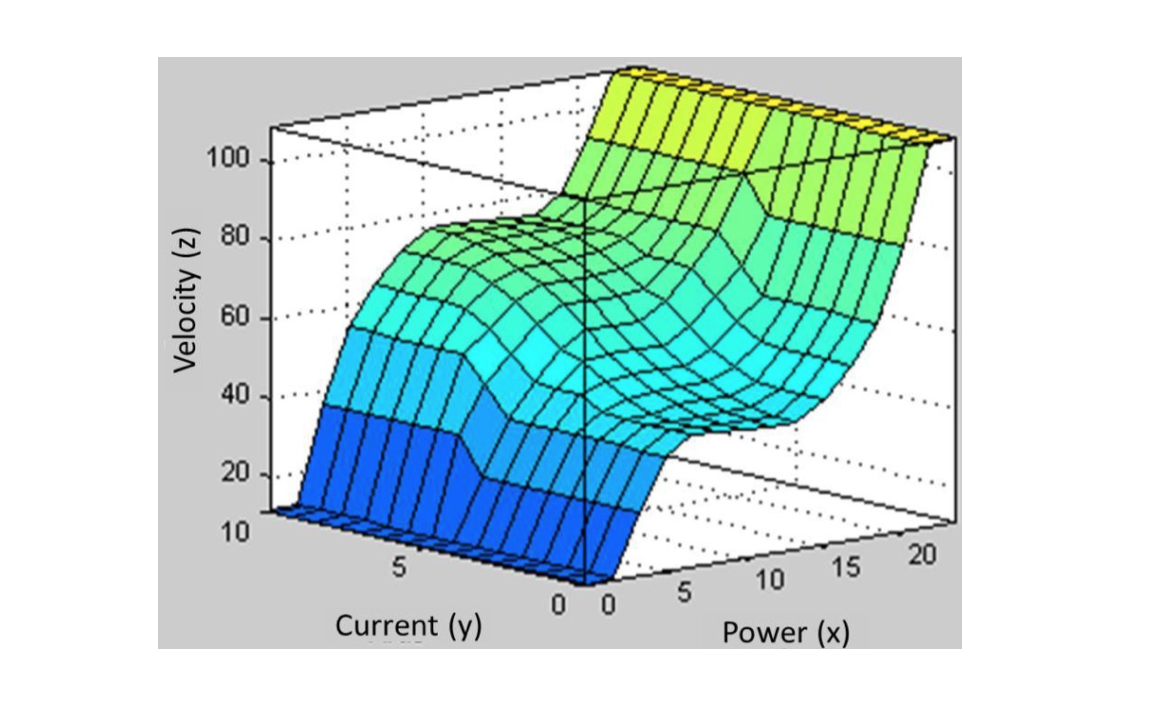
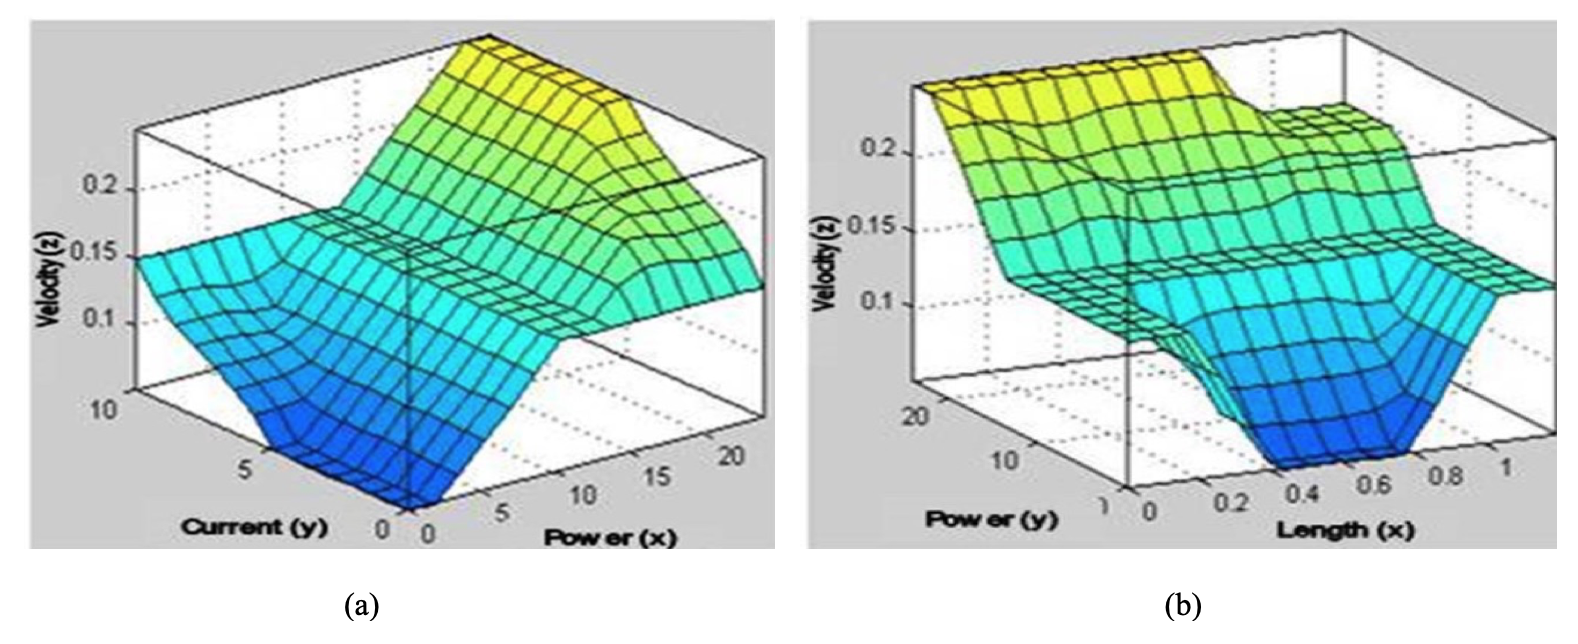
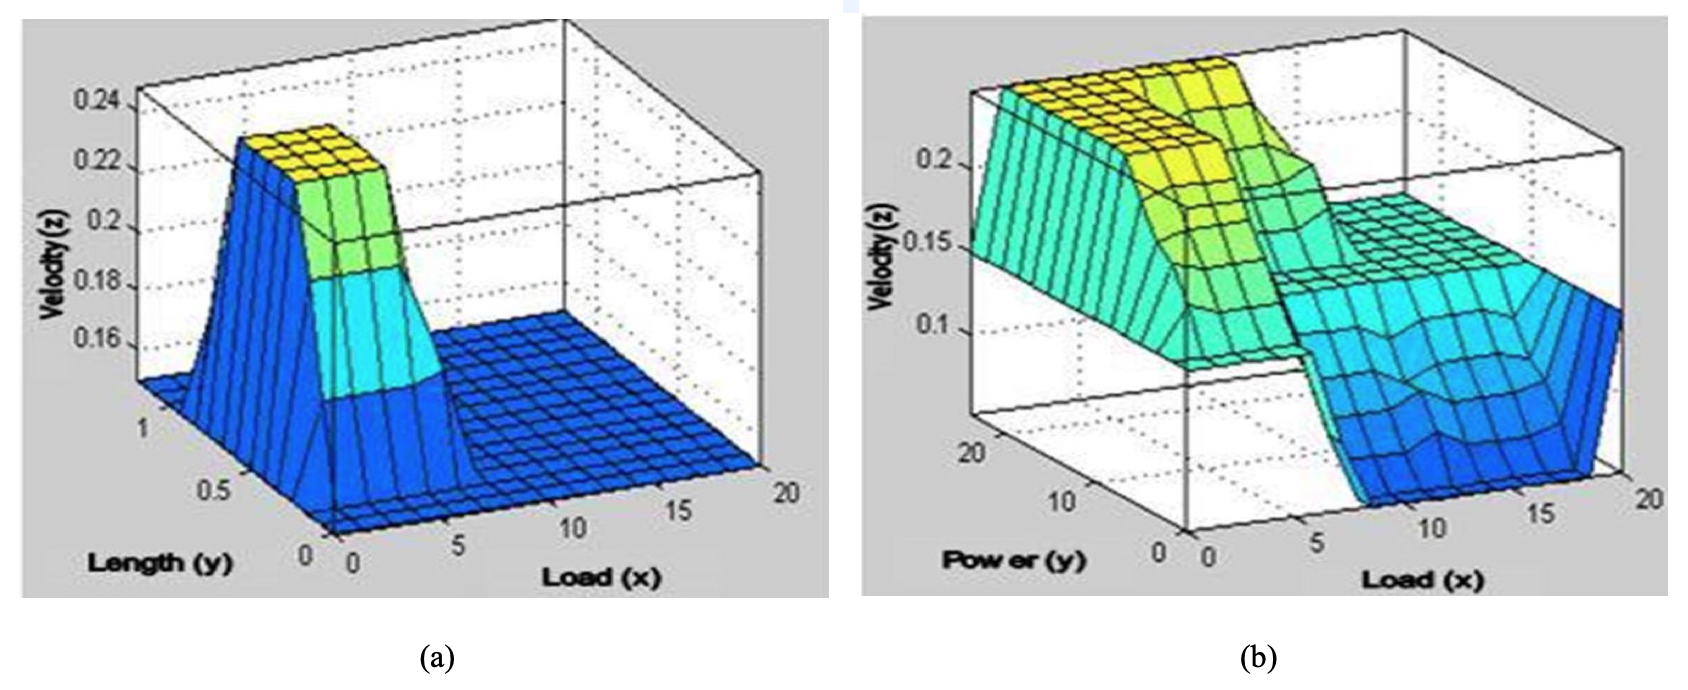
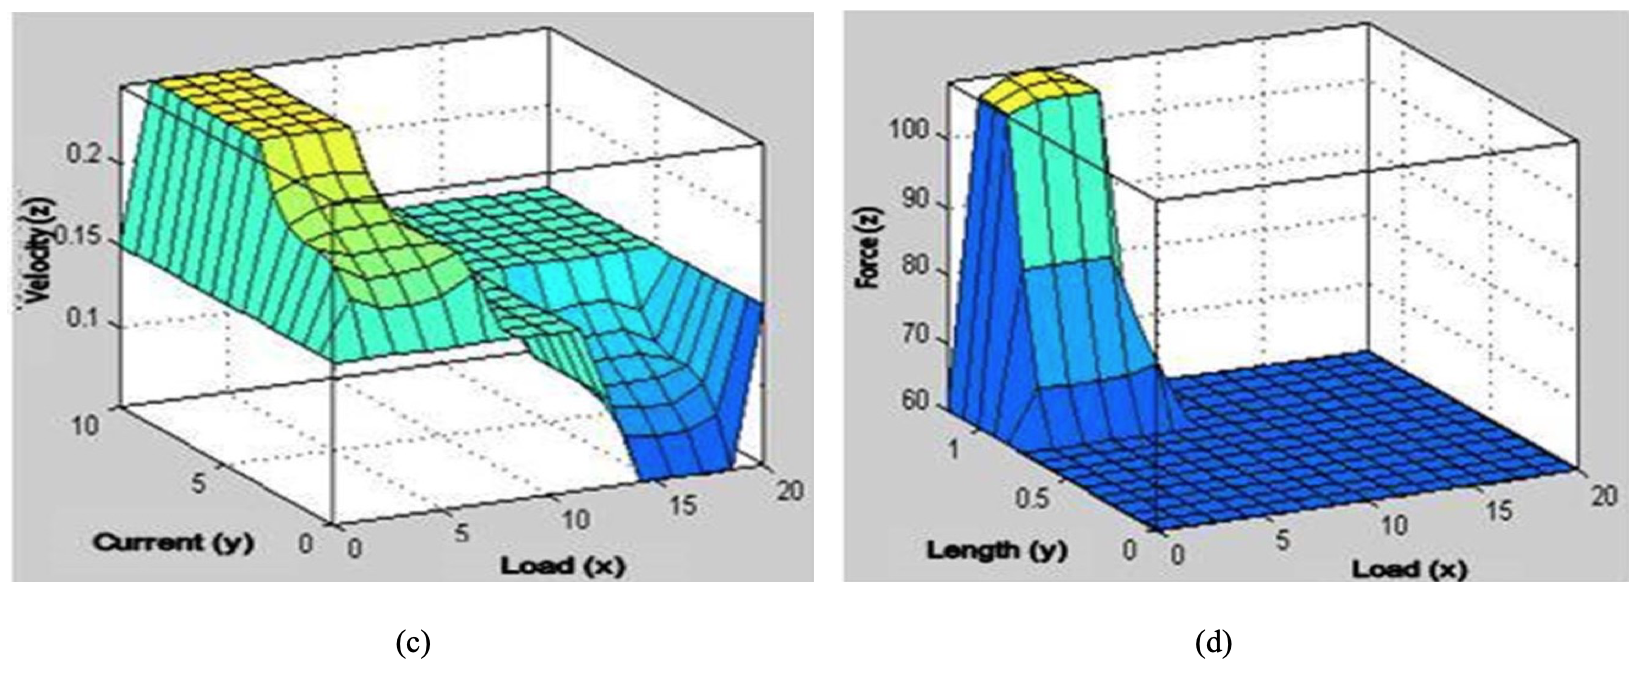
Based on the rules in Table 2 and Fig. 2, the experiments are conducted seen in Fig. 3 and 4. The graphics results are obtained from the variation of the load, which produces ripple on speed which is quite sharp, continue with the changing of the weight and conclude that the motion of the rate depends on the load variations and mileage, as shown in Fig. 1.
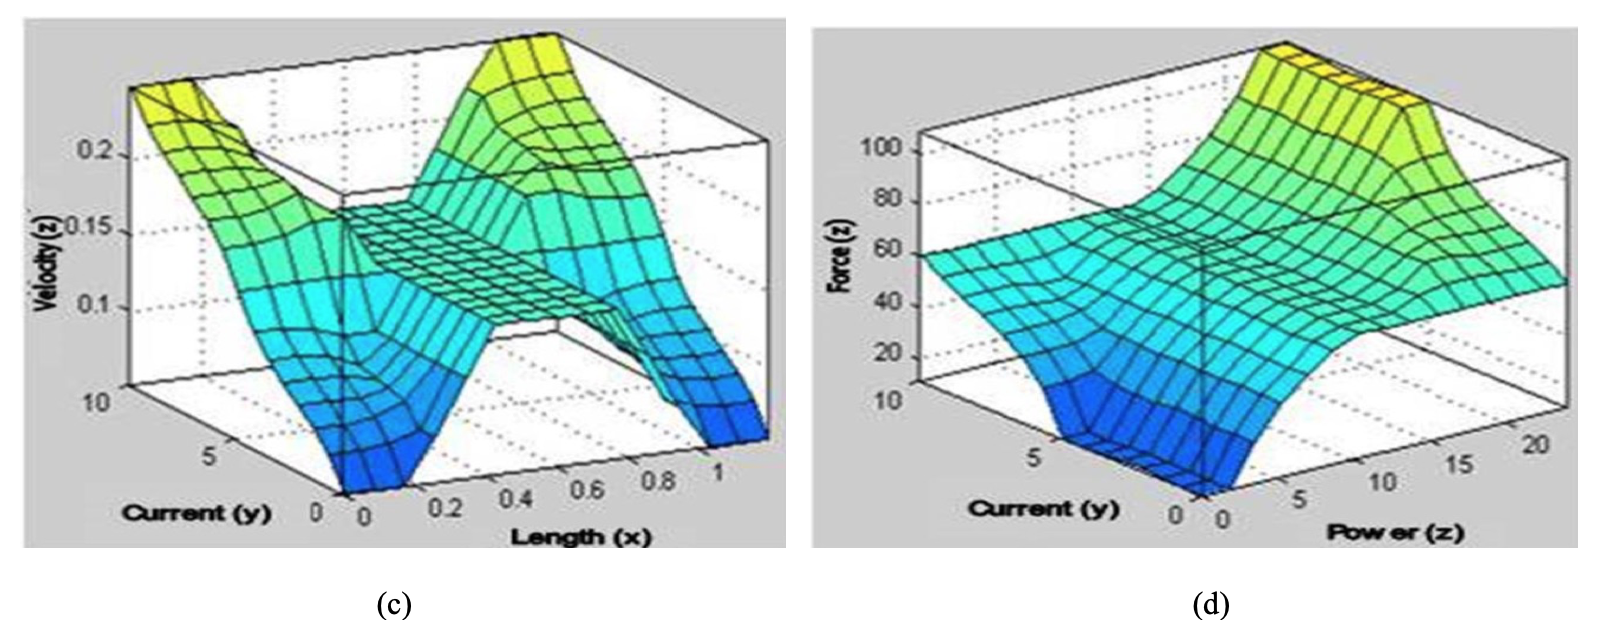
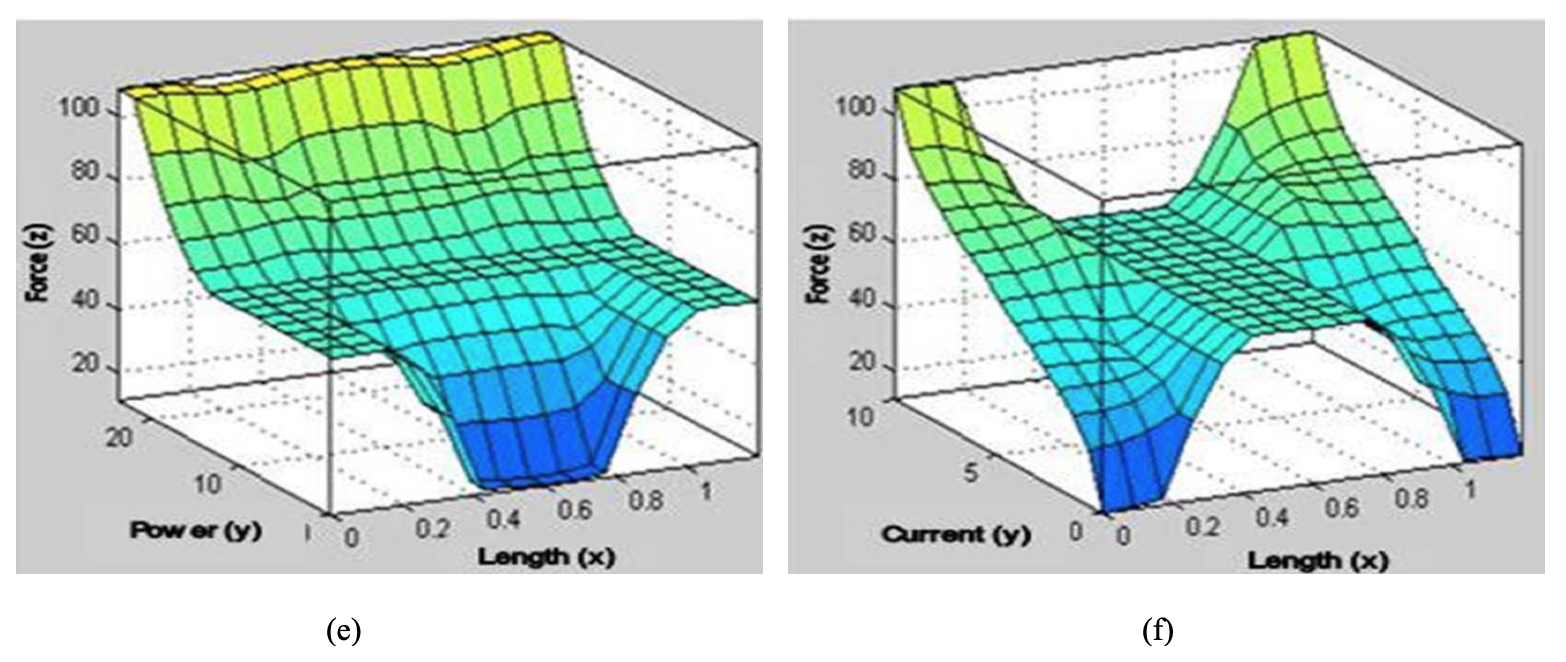
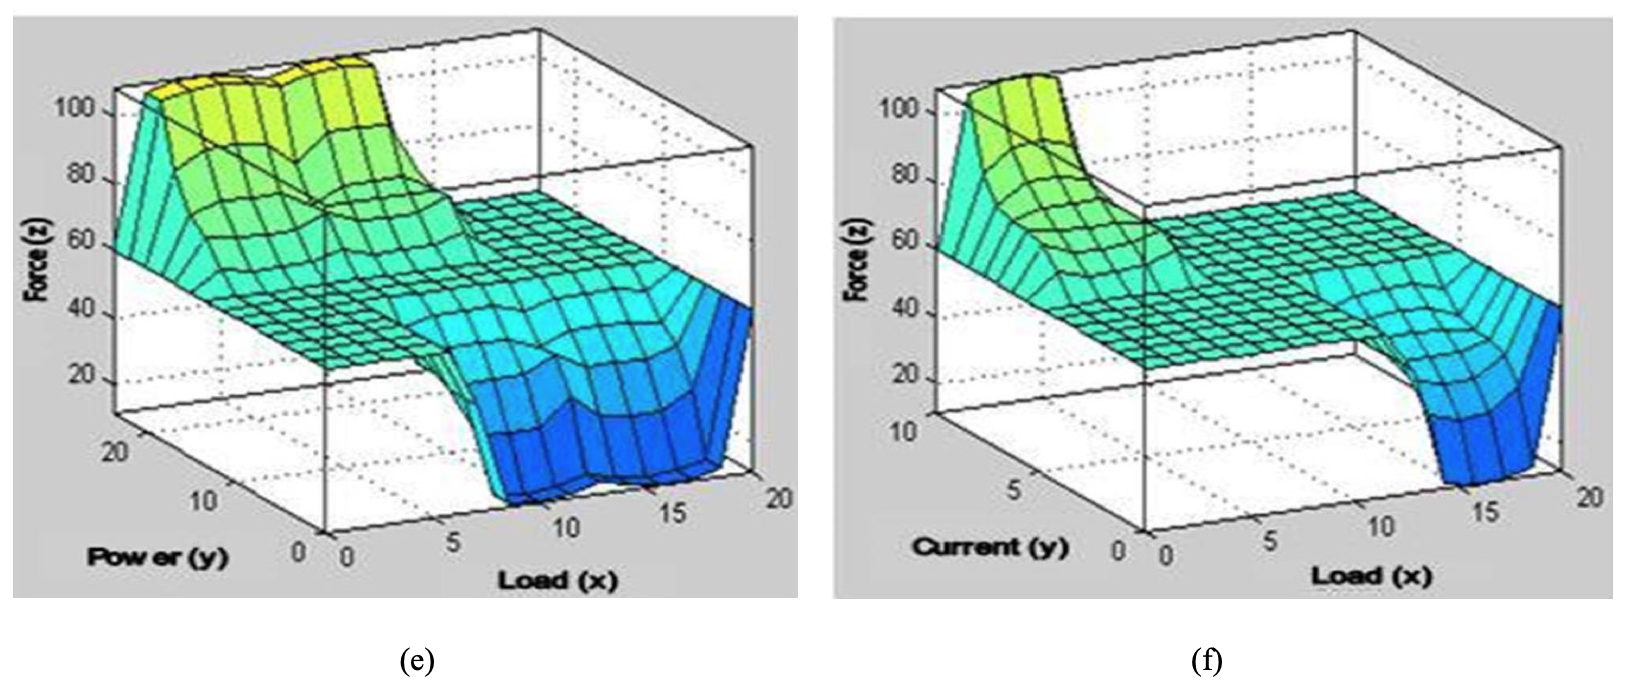
Whereas, in Fig. 4, the ripple on force shows less rigid ripple while current and power change variation goes by. This graph shows that force ripple does not happen because of load changing but by the change of current and power which is fitted with the basic formula of Electromagnet. On the other hand, current change is not influenced by the ripple, while the dominant power affects the stability of the force as in Fig. 4. To analyze the system behavior on simulation test results in Fig. 5 and 6 are made with variable Input: Load, distance, Power, Current and Output: Speed, Style, observe the fluctuation happened on every part of the test.
Figure 5 shows that ripple happened because of variation changing of the load value. High ripple on force and velocity is also affected by the changing. On the other hand, power and current relatively stable which are not affected by load changing. It is rather odd since the force produced by the value of energy and current. Figure 6 shows the changing amount of load and distance significantly affect the speed and strength by bringing in high and sharp fluctuations ripple wave while current and power do not have much influence and relatively stable. Figure 6 shows that high value of current and power has produced relatively small ripple so that the speed and force are more durable and load does not affect force. However, something happened when variations value of current input, power versus distance, which significantly affect the stability of systems seen on the ripple wave in the graph. The simulation in Fig. 6 concludes that gap is the main subject for the existence of ripple on force and power.
Fuzzy-PID: For the comparison result on simulation with fuzzy controllers, simulations are also tested by using PID controllers to improve the results on output. The fuzzy logic controller may be considered as a nonlinear PID controller whose parameters can be determined on-line based on different error signals and time derivatives. Fuzzy rules and reasoning are useful to decideon the controller parameters and PID controllers are helpful to generatesignals control. The transfer function of the PID controller has the following form, where K, Ki and Kd are proportional, integral and derivative, respectively useful as a form of PID controller:
where,
Ti = K/Ki
Td = Kd/Kp
T and Td as integral time and derivative constants. The control parameters of PID Kp, Ki and Kd or K, Ti and Td can be manipulated to generate the various curve responses of a process.
| Parameters | Value |
|---|---|
| Force | 120 N |
| Load | 20 kg |
| Current | 10 A |
| Speed | 0.2 m/sec |
| Distance | 0.6 m |
| Power | 24 W |
| Function | Variable | Fuzzy | Test parameter | a | b | c |
|---|---|---|---|---|---|---|
| Input | Load | Light | 20 kg | -10 | 0 | 10 |
| Medium | 0 | 10 | 20 | |||
| Heavy | 10 | 20 | 30 | |||
| Distance | Near | 0.6 m | 0 | 0.075 | 0.300 | |
| Medium | 0.075 | 0.300 | 0.525 | |||
| Far | 0.300 | 0.525 | 0.750 | |||
| Output | Velocity | slow | 0.2 m/sec | 0 | 0.030 | 0.060 |
| medium | 0.060 | 0.100 | 0.130 | |||
| fast | 0.130 | 0.160 | 0.200 | |||
| Input | Power | weak | 24 W | -9.600 | 0 | 9.600 |
| Normal | 2.400 | 12 | 21.600 | |||
| strong | 14.400 | 24 | 33.600 | |||
| Current | Low | 10 A | -5 | 0 | 5 | |
| Normal | 0 | 5 | 10 | |||
| High | 5 | 10 | 15 | |||
| Output | Force | Low | 120 N | -25 | 0 | 35 |
| Normal | 25 | 60 | 95 | |||
| Strong | 85 | 120 | 155 |
Results And Discussion
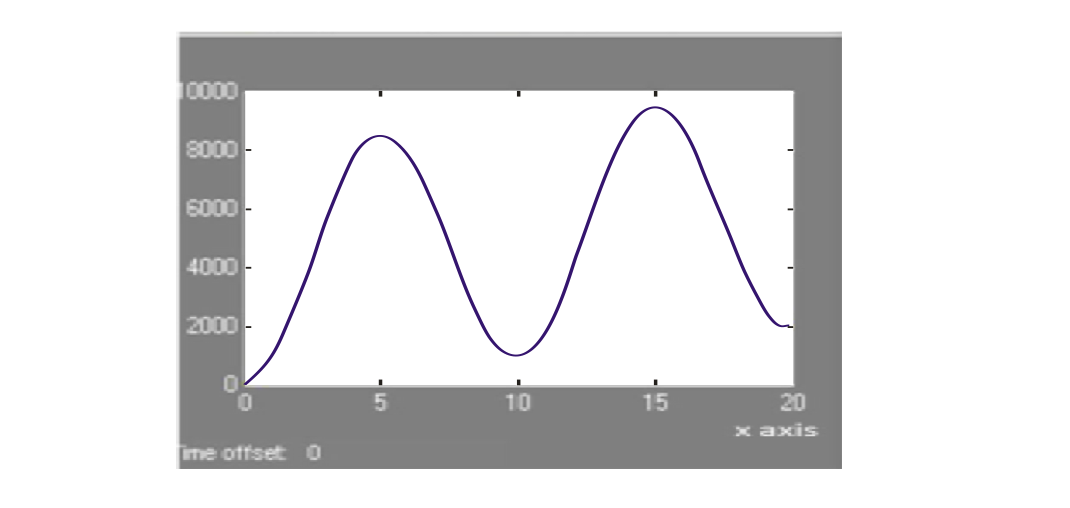
To support on previous research by (Lim and Krishnan, 2007) on Input curve graph is the result of first parameter display before experiencing Fuzzy-PID process. Meanwhile, the graph 'Output' curve is the result of the show after experiencing Fuzzy-PID process, a visible difference of very significant fluctuation between Input and Output with high Y-axis value at the input reaches 9000 while the Y-axis on the Output is only 30. So, it can be concluded that Fuzzy-PID control can influence the signal control and decrease the fluctuation curve, as seen in Fig. 5.
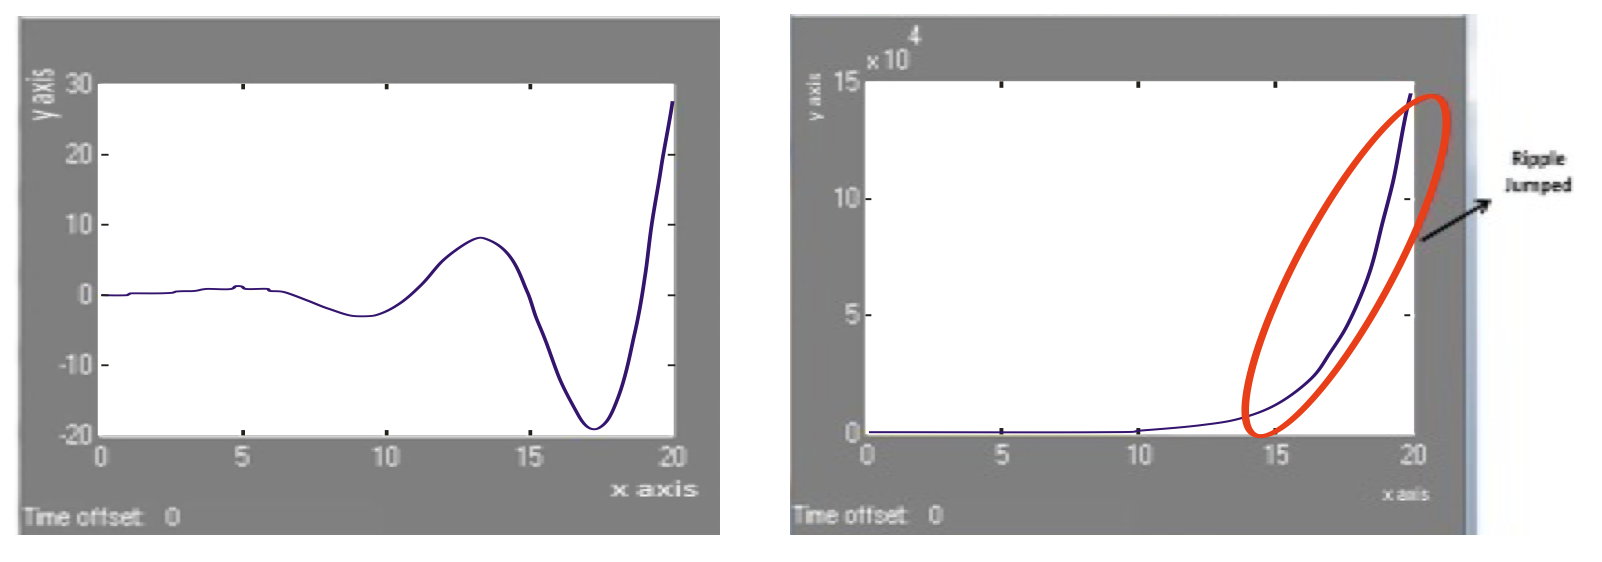
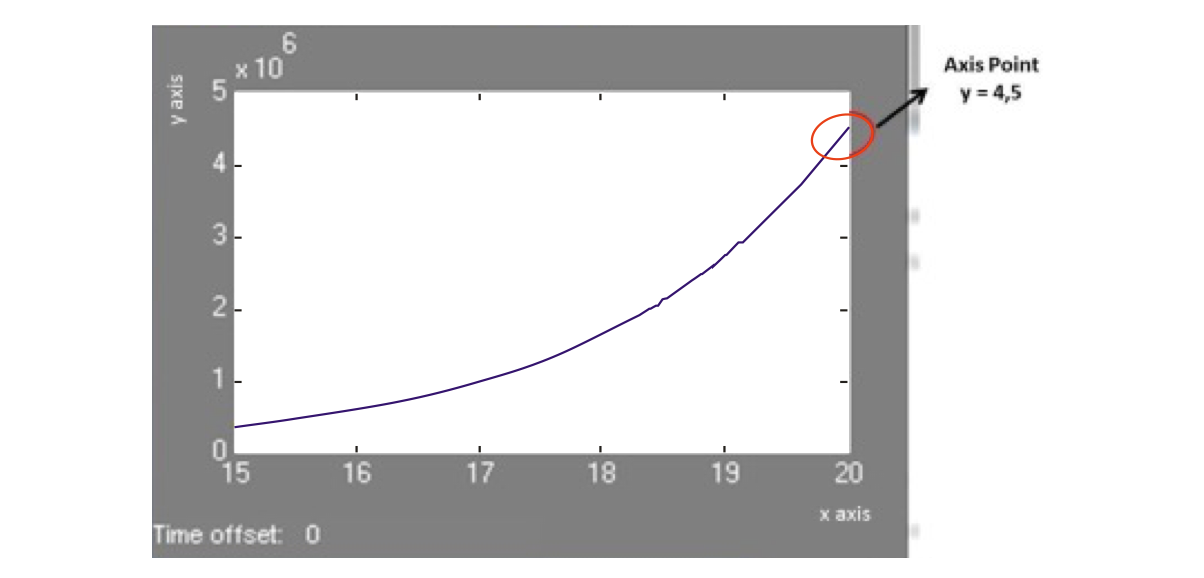
If the load parameter is changed, there will be a change of fluctuation. For example, the passenger load increases then the matrix into two coefficients. To determine the parameter value, the researcher needs to find its matrix value first. For example, the weight is 3 kg then the matrix value f (x) = x-2y and the parameter value is the results of a graph as in Fig. 6. Figure 7 shows the result of the ‘Input’ graph that has not been through the Fuzzy-PID process where the y-axis visible at 15-20 interval experiences asharp spike with the y = 15 axis at x = 20 range which means the higher y-axis value at interval x next. Figure 8 is when the graphic results have undergone a fuzzification process that spikes on the y-axis are not to sharp and tends to be more stable, as seen in y-axis = 4, 5 and x= 20 as seen in Fig. 9.
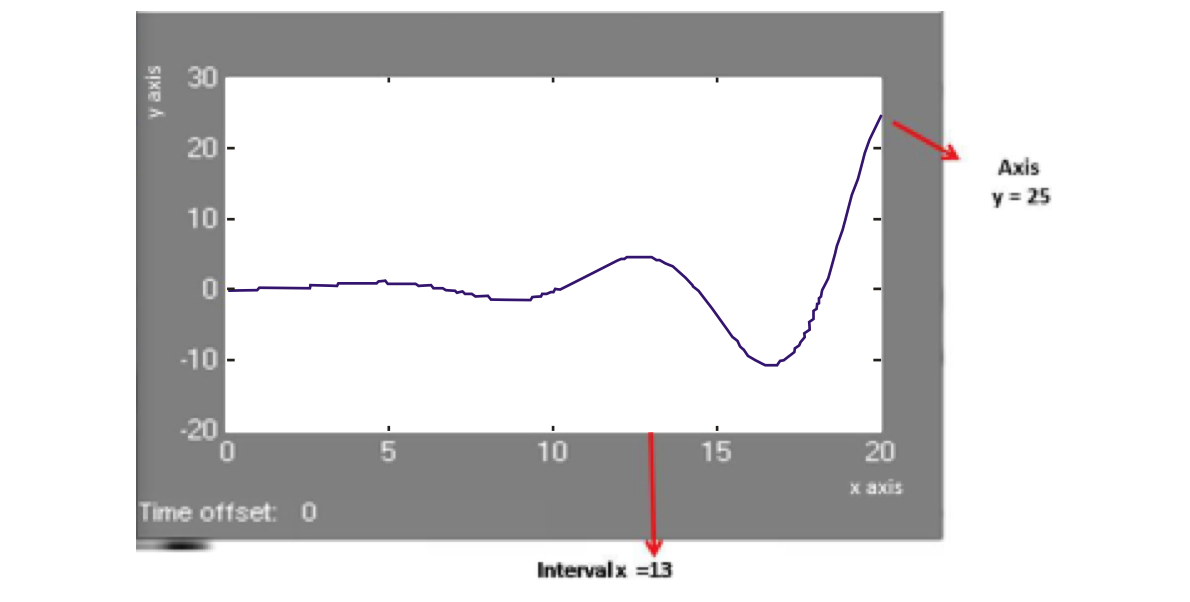
Moreover, in Fig. 10 on the output of the graph after going through the Fuzzy-PID, the process is relatively stable spike until the interval point x = 13 experiencespikeupto y = 5 axes, then decrease to they-axis point atinterval x = 17 then jumped sharply at range x = 20. It means that the Fuzzy-PID process has more variation fluctuations up and down due to the operation of PID experiencing the process of error and d-error so that the error position will decrease and vice versa. This PID process can be a suitable controller because it can detect errors better.
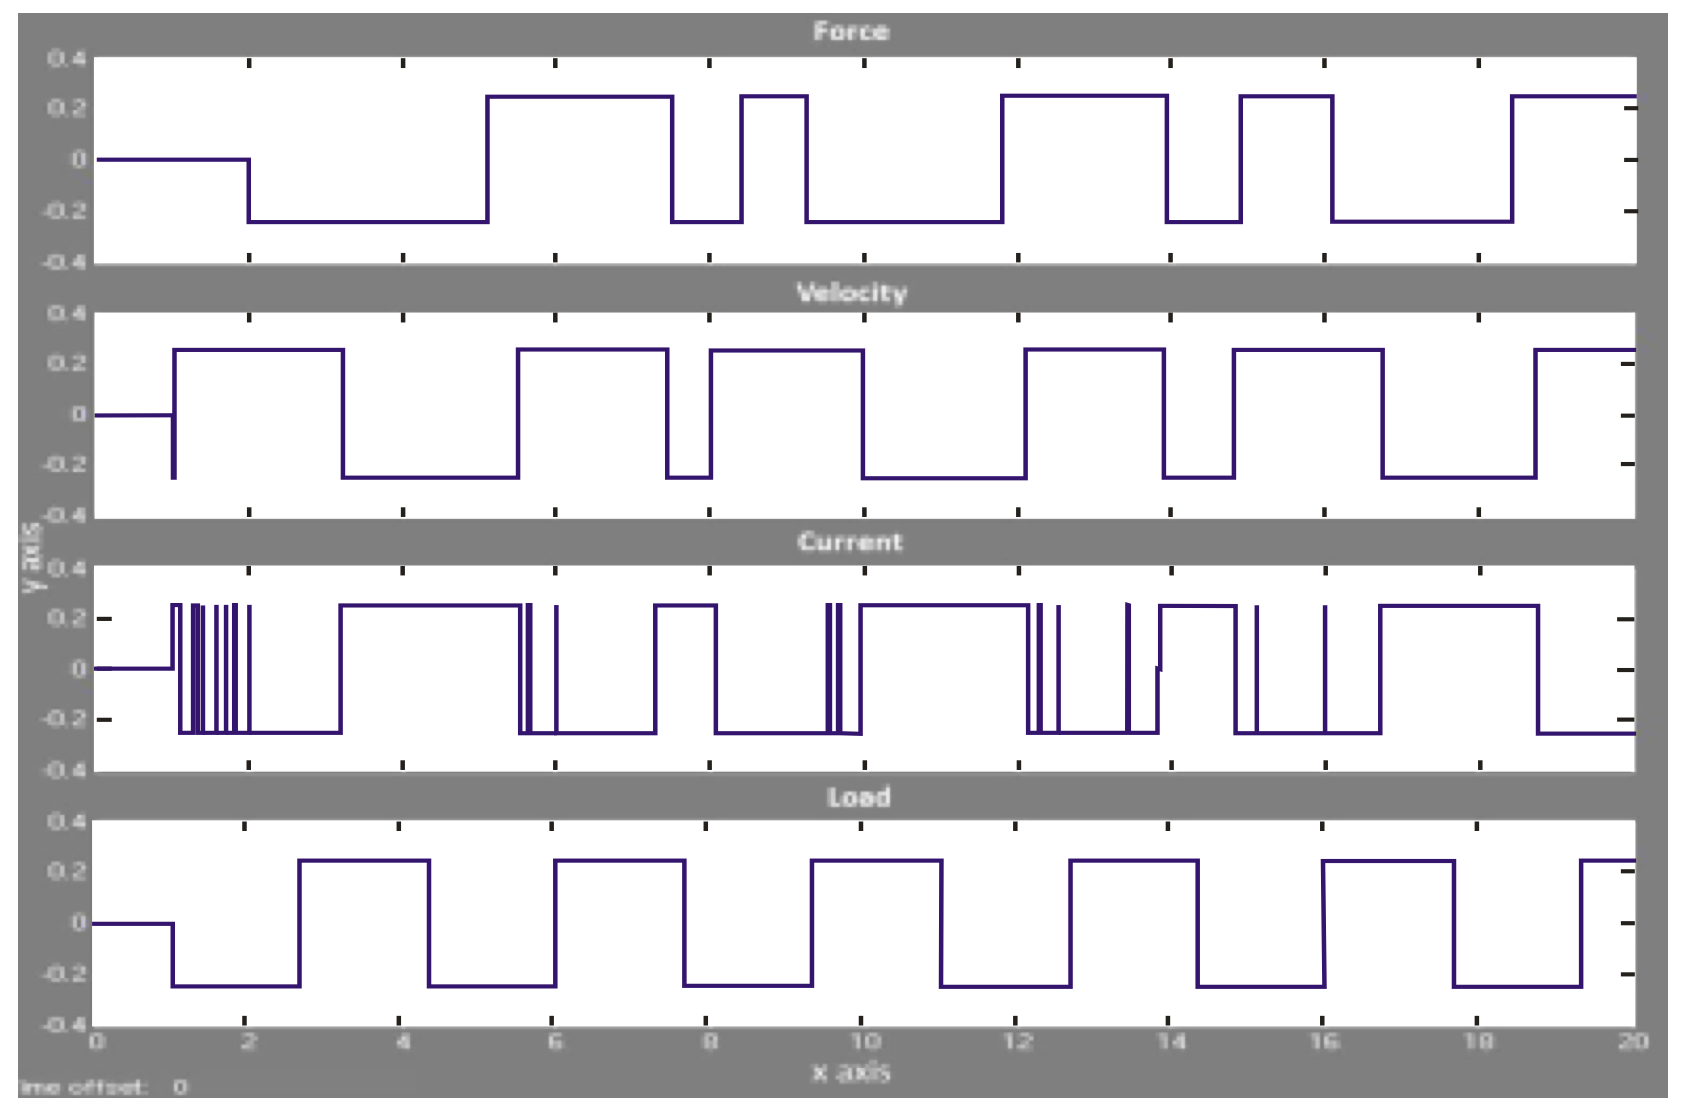
- Fuzzy-PID test with 4 input: For more comfortable analysis purpose on how the behavior of ripple describes the detent force, the researcher makes the simulationswith fourinputs: the strength, current, load and velocity that also produces four output as in Fig. 11.
Graph of input curve: Force, current, load and velocity, is the result of first parameter display before experience Fuzzy-PID process. Meanwhile, the figure of Output curve is the result of the display after experiencing Fuzzy-PID process. It shows that the difference of significant fluctuation between Input and Output with high Y axis value on average Input reach ten while the axis Y on Output does not exceed 0.5. Fuzzy-PID control can influence signal control and make curve ripple more stable, as seen in Fig. 11 and 12.
- By conducting the simple simulation in Fig. 11, from top to bottom, are a force, current, load and speed show that force ripple is small due to variations on weight and distance. However, something conversely happened on a current that showed many ripples which high loses happened and also high thermal effected to the cabin or systems. Other strange things also happened as seen in Graph of speed that shows fewer ripples than the others which suppose rate must be linear with the changing of current and load. By analyzing Fig. 11, results are relatively contrary to the previous simulation that only use a fuzzy controller.
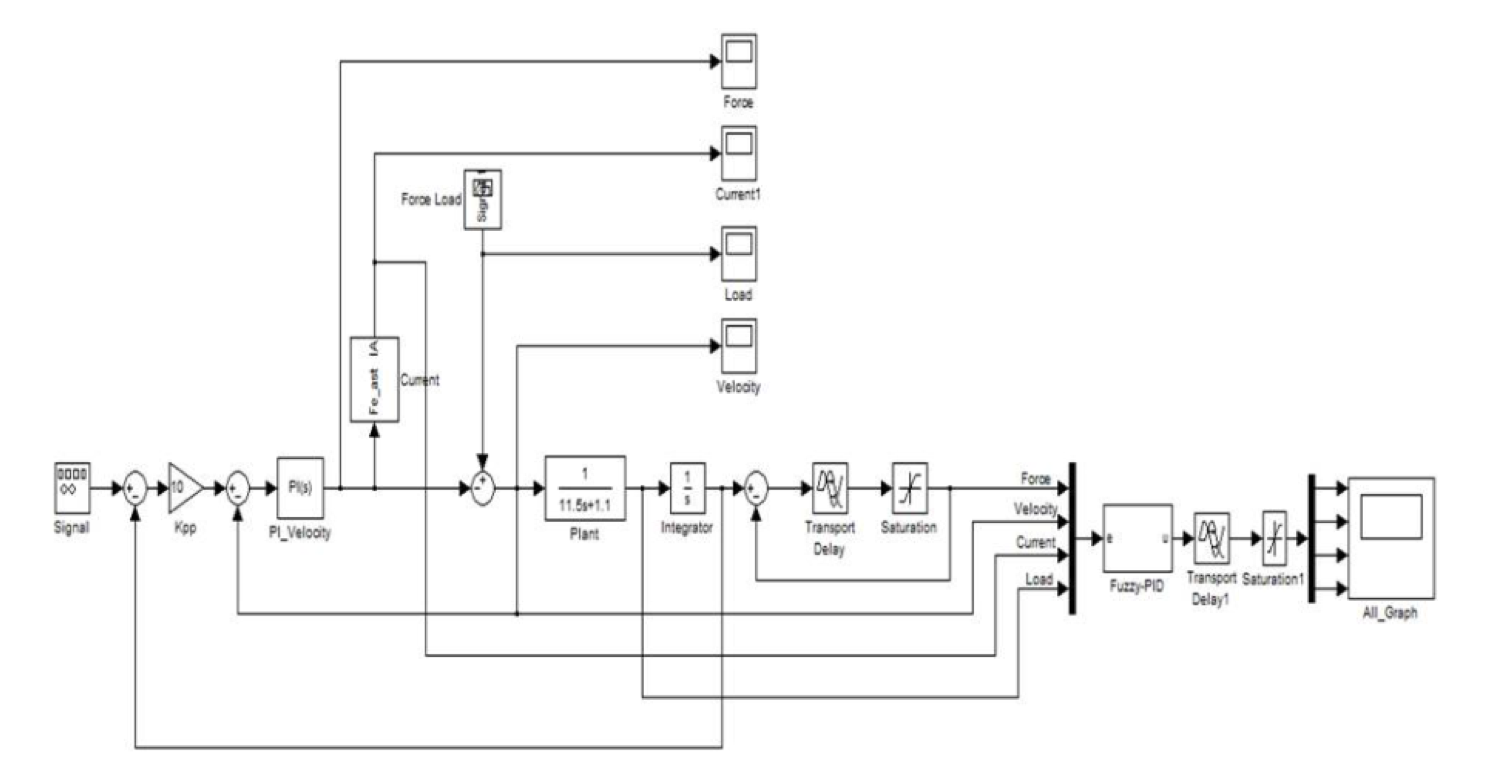
- Comparison of PI controller with fuzzy controller test: Simulation is made to see how the system is affected by the fuzzy PID controller which already succeeded on reducing detent force with PI controller on current. By using models on previous paper by Lim and Krishnan (2007), with PI controllers, a simulation was made with result in Fig. 13.
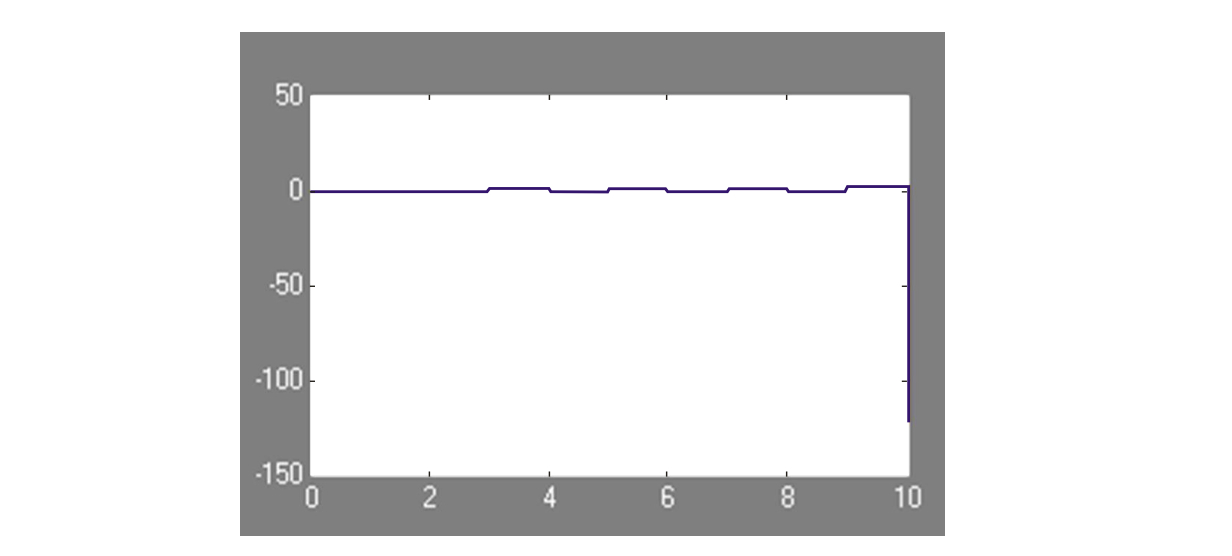
- The results of Graph Model Block with PI Controller in the block model with PI Controller have four ripples. The graph shows up at 1.8 times 3 then down at point -1.9 times 4, rises back at 1.55 time five then goes down at -16-time point 6, rises back to point 1.15 time seven then drops at the end -14 times 8 and rises again at the point 1.4 times 9. Figure 14 shows that ripple happened on current and might produce vibration on force and noise by distance.
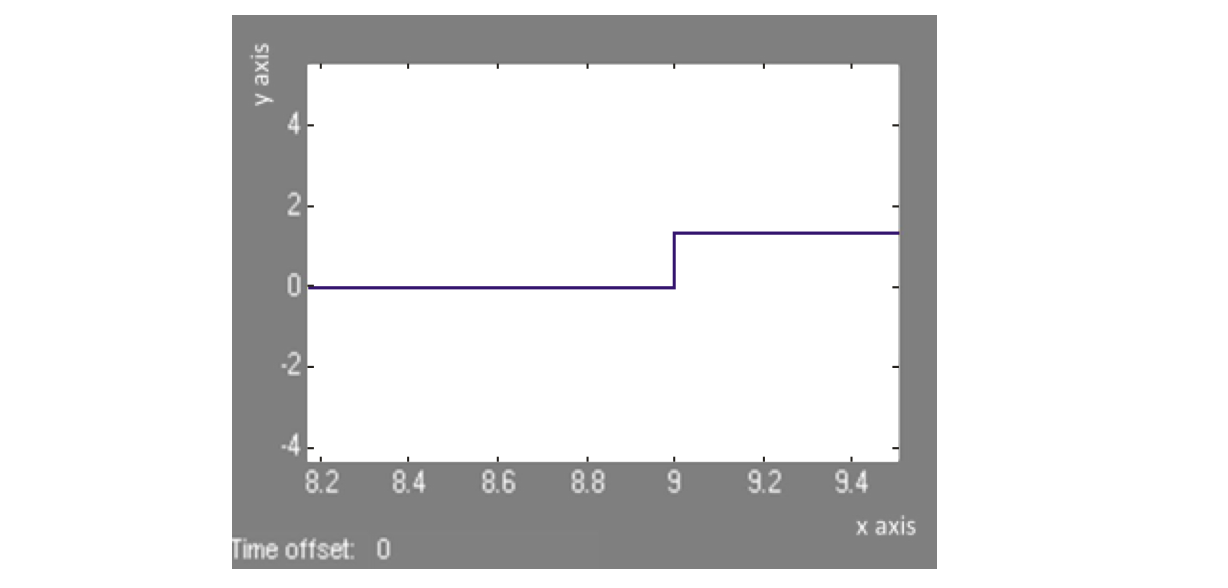
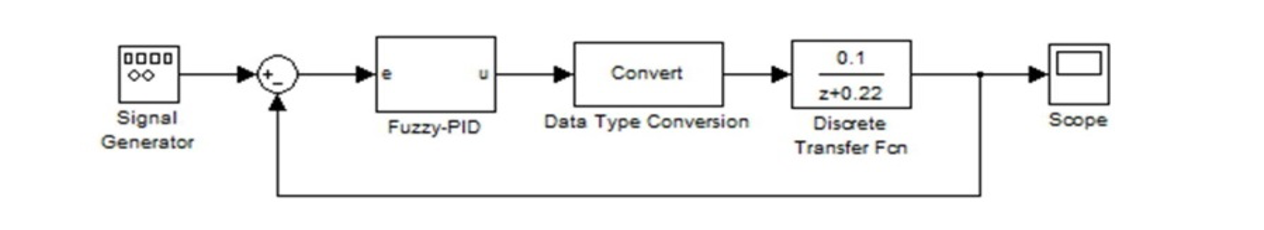
- Model block with fuzzy-PID controller: Simple simulation is made on systems with Fuzzy-PID controller, base on diagram block on Fig. 15. Figure 14 shows that ripple shows relatively less than the previous one. In the block model, Fuzzy-PID Controller is experiencing one ripple and the graph shows a decrease at -7-time point 9. The simulation result concludes that system with a high-level controller can reduce ripple without changing the structure of methods which make it efficient in time and cost production.
Conclusion
The purpose of the simulations is to analyze and predict how ripple which represents detent force behavior in a system with Fuzzy-PID controller. From all the simulation, the conclusions are:
- Fuzzy logic can be used to investigate the performance of elevator control by testing some block diagram model outline that has the same results. The selection of membership function and fuzzy rules can affect the output results.
- Fuzzy logic shows significant results with precise accuracy of values. In a substantial lift, control simulation test of its load and mileage value significantly affects the graphics output with ripple waves are quite sharp.
- Fuzzy-PID controller can relatively minimize detent force, with fast respond.
- Using the controller might be one of the best choices to reduce the detent force without changing the structure of the system.
- More research must be conducted for other parameters such as saturation and hysteresis of the magnet.
Author Details
1Department of Electrical Engineering, Universitas Indonesia, Depok 1624, Indonesia
References
Ainil, S., M.K. Iwa Garniwa, G. Ridwan and A. Made, 2016. Simulation of braking and variation of load in switched reluctance linear motor. Proceeding of the 3rd International Conference on Information Technology, Computer and Electrical Engineering (ICITACEE).
Gore, A.M. and D.S. More, 2013. Performance investigation of shunt active power filter with PI and fuzzy controllers. Proceeding of the IEEE International Conference on Control Applications (CCA).
Ismail, S. and A. Abdullah, 2013. Controlling of load elevators by the fuzzy logic method. World Acad. Sci. Eng. Technol. Int. J. Elect. Comput. Eng., 7(8).
Karim, J., S. Mohamed and M.N. Alias, 2008. Fuzzy based intelligent control system for elevator. University Teknologi Mara, Shah Alam, Selangor, Malaysia.
Khiang, T.K., M. Khalid and R. Yusof, 1999. Intelligent elevator control by ordinal structure fuzzy logic algorithm. Centre of Artificial Intelligent and Robotics University Teknologi Malaysia.
Lim, H.S. and R. Krishnan, 2007. Ropeless elevator with linear switched reluctance motor drive actuation systems. IEEE T. Ind. Electron., 54(4): 2209-2218.
Patiño-Forero, A.A., D.M. Muñoz, G.C. de Carvalho and C.H. Llanos, 2012. Fuzzy elevator group control system using technology for industrial automation. Proceeding of ABCM Symposium Series Mechatronics, Vol. 5.
Selvaperumal, S., C. Christober Asir Rajan and S. Muralidharan, 2013. Stability and performance investigation of a fuzzy-controlled LCL resonant converter in an RTOS environment. IEEE T. Power Electr., 28(4): 1817-1832.
Shin, J.S., T. Koseki and H.J. Kim, 2012. Design and evaluation of short armature core double-sided transverse flux type PMLSM. Proceeding of the 15th International Conference on Electrical Machines and Systems (ICEMS).
Shin, K.H., K.H. Kim, K. Hong and J.Y. Choi, 2017. Detent force minimization of permanent magnet linear synchronous machines using subdomain analytical method considering auxiliary teeth configuration. IEEE T. Magn., 53(6).
Rights and permissions
Open Access: This article is licensed under a Creative Commons Attribution 4.0 International License, which permits use, sharing, adaptation, distribution and reproduction in any medium or format, as long as you give appropriate credit to the original author(s) and the source, provide a link to the Creative Commons license, and indicate if changes were made. The images or other third-party material in this article are included in the article’s Creative Commons license, unless indicated otherwise in a credit line to the material. If material is not included in the article’s Creative Commons license and your intended use is not permitted by statutory regulation or exceeds the permitted use, you will need to obtain permission directly from the copyright holder. To view a copy of this license, visit http://creativecommons.org/licenses/by/4.0/
Cite this Article
Ainil Syafitri, 2020. Simulation of Control Elevator Use Fuzzy Logic Method. Research Journal of Applied Sciences, Engineering and Technology 17: 106-114. http://doi.org/10.19026/rjaset.17.5456
Received
Accepted
Published
June 17, 2019
July 27, 2019
August 25, 2020
DOI: http://doi.org/10.19026/rjaset.17.5456
Sections
Abstract
Keywords
Introduction
Materials And Methods
Fuzzy-PID
Results And Discussion
Fuzzy-PID test with 4 input
Graph of input curve
Comparison of PI controller with fuzzy controller test
Model block with fuzzy-PID controller
Conclusion
Author Details
References
Rights And Permissions
Cite This Article