
Alidokht, S.A., A. Abdollah-Zadeh, S. Soleymani, T. Saeid and H. Assadi, 2012. Evaluation of microstructure and wear behavior of friction stir processed cast aluminum alloy. Mater. Characteriz., 63: 90-97.
Research Journal of Applied Sciences, Engineering and Technology
Tribological Characteristics of Commercial Metals
Research Journal of Applied Sciences, Engineering and Technology 2020 17: 122-128
Cite This ArticleAbstract
This project conducts a study on wear performance and frictional behaviour of selected metals against stainless steel counterface under dry contact condition. The chosen materials for conducting this study are mild steel, copper and aluminium. The parameters used for inspection and analysis of this project are applied load (0-90N) and sliding distance (0-14 km). Block on ring machine was used to conduct the adhesive wear testings. The worn surfaces are examined and wear mechanisms are categorized using scanning electron microscopy. The results reveal that copper shows better wear properties and aluminium shows less friction. Mild steel exhibits a high rate of wear and material removal. All three materials revealed three different wear mechanisms; aluminium (abrasive and adhesive), mild steel (abrasive and ploughing), copper (adhesive).
Keywords:
Introduction
The metals operating with contact with each other is often associated with wear and tear. There have been numerous studies conducted to examine the wear and frictional behavior of metals working under different parameters. However, the demand for further studies is enormous as there are numerous applications for metals like aluminium, mild steel and copper. The operating parameters have like sliding distance, sliding velocity, applied load, temperature developed at the interface influence the wear mechanism and frictional performance of the materials (Prasad, 2011; Kumar and Bijwe, 2011; Alotaibi et al., 2014b; Tewari, 2012; Yousif, 2013). Kumar and Bijwe (2011) investigated the frictional behavior and wear characteristics of cast iron and found that the progressive loss of material from the surface due to wear increases with increase in applied load. Alotaibi et al., (2014b) observed different wear mechanisms: body abrasion and pure adhesive wear, in an experimental study conducted on brass, aluminium and mild steel. Ruiz-Andrea et al., (2015) explain the decrease in frictional co-efficient with increase in load in a study conducted on mild steel. Furthermore, a lot of papers reported the influence of temperature rise in unusual frictional behavior and wear characteristics of copper under application of high loads and high velocity (Natarajan et al., 2006).
Most of the reported works have published their findings in individual formats they have chosen which includes weight loss, volume loss, wear resistance, wear rate. This makes the future researchers difficult to compare the findings. Presenting the works in terms of specific wear rate is highly recommended as they can be a standard for comparison of similar studies. This motivation persuades the current study to examine the frictional behaviour and wear performance of aluminium, mild steel and copper sliding against a stainless steel counterface under dry contact condition, in terms of specific wear rate, for different operational parameters.
Materials And Methods
This study was conducted at Department of Automotive and Marine engineering Technology, Public Authority for Applied Education and Training, Kuwait and Faculty of Health, Engineering and Sciences, University of Southern Queensland, Toowoomba, QLD, Australia between 2018-2020.
Material preparation: Adhesive wear occurs when metals of similar surface hardness or roughness are slide against each other under the application of load. The asperities or high points on either of the surface or specimen or counterface can immensely influence the wear performance of the metals. Hence, it is of prime importance to smoothen the surfaces in contact with similar roughness and to remove any asperities or high points. This is the primary stage before the experiment. Materials supplied for the project might not have the desired surface roughness to carry out the experiment. The materials are brought to required surface roughness by manually scrubbing the specimen with sandpaper of different grades. Sandpaper of grade ranging from 600-1500 are used according to the behavior of the metal. A surface roughness less than 1 µm is the objective. The counterface, which is stainless steel, also must be brought to this surface condition using the sandpaper. Since manually doing this is difficult and time-consuming, the tribology machine is used for achieving this target. A sandpaper of required grade is placed between the workpiece and counterface and the counterface is rotated at high speed and large applied load. In accordance with the grade of the sandpaper, the smoothness is achieved at the surface of the counterface. This is then measured with Mahr (MarSurf PS1). If the required surface finish is not achieved, the process is repeated using sandpaper of higher grades. After surface preparation of materials, the weight of the specimen is measured using a digital weighing machine. The weight is then corrected to four decimal places.
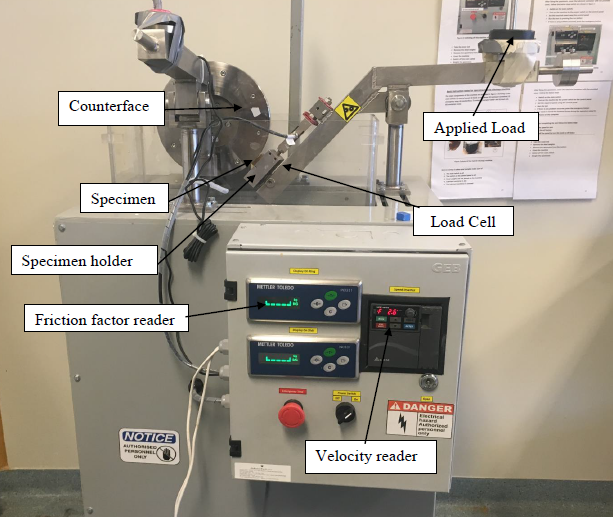
Experimental procedure: The experiment is carried out in 3 stages, initial stage, running stage and measurement stage. Initial stage consists of setting the operational parameters of the experiment and placement of workpiece in the holder. The experiment is conducted using the selected materials and counter bodies using a block on ring technique which is shown in Fig. 1. The velocity is set to a constant value of 3 m/sec. Applied loads can be changed according to the experiment requirements by placing weight in the specimen holder (Fig. 1). The experimental process is started with a minimum load specified for each material. Since the hardness and material removal rate of each material is different, the loads at which the experiments are carried out will be slightly different to achieve consistency and risk of rupture. The applied loads for aluminium was determined to be 10, 20, 30 and 50N and that of mild steel and copper was decided to be 30, 50, 70 and 90N, respectively. The next two stages happen consecutively, the first being the running stage followed by the measurement stage. The counterface is rotated at a constant speed and is rubbed against the specimen material. After every regular interval of 20 min, the workpiece is removed from the holder and the surface roughness is measured using Mahr (MarSurf PS1). Using the same device, the counterface is also analyzed for its surface orientation values. The experiment is then continued for a sliding time of about 160 min. During random times of the experiment, frictional force values are noted from tribology machine. The force developed between the contact surfaces will be constantly changing in accordance with the intimacy of the surfaces and interaction of asperities. The frictional factor reader (Fig. 1) on the block on ring apparatus can give instantaneous values of normal forces developed at the surface of contact. After finally removing the material from the holder, the weight of the workpiece is again measured to calculate the weight loss of the material. The microstructural images of the workpieces are then taken using scanning electrode microscopy. The workpiece is cleaned using acetone before taking images to get a clear photograph of the material surface.
The wear behavior of the metals is identified using the analysis of graphs plotted. The wear rate at different operational parameters is analyzed. The wear rate of the metals at different loads are plotted against the operational time, which significantly can provide the wear behavior of the materials against the counter body. Roughness profile of each material against stainless steel counterface before and after the test are recorded and analyzed to get a review on the correlation between the relationships of each material with counterface. The frictional force recorded during the experiment are analyzed. Fluctuations in the coefficient of friction under different operational parameters are investigated during the testing. Any variation from the normal behavior of the metal observed is interpreted critically and discussed. The effect of the applied load on each of the specimen when sliding against a stainless steel counterface is carefully studied using the term specific wear rate. Specific wear rate is the volume of material loss from the surface of the workpiece per unit loadEq. (1). The relationship between sliding time and the specific wear rate can reveal the wear behavior of metals under the varied application of different loads:
where,
The frictional behavior of metals during dry sliding can be explained with friction co-efficient calculated from normal contact forces (See). Co-efficient of friction is plotted against sliding time which can reveal the variation of friction throughout the running process and thereby could be related to wear behavior of each material. Based on the results obtained each material will be compared and conclusions are discussed:
where,
Examination of the worn surfaces of the materials is one of the major phases of the project. The worn surface will have a huge influence on wear rate and frictional behavior of the materials. Since the test is carried out under dry contact conditions the surface was worn will be large enough to reach conclusions. It will give a clear understanding of the effect of the applied load and other parameters on the wearing of the metal. The relationship of the developed temperature and applied loads can be studied with more clarity with the help of images from a scanning electrode microscope. The roughness profile images will be stored for future references on the selection of materials for doing a specific job.
Results And Discussion
The specific wear rate for aluminium, mild steel and copper sliding against a stainless steel counterface is obtained. The frictional behavior is represented in terms of frictional coefficient versus sliding distance at an applied load of 30 and 50N in Fig. 2 and 3 respectively. The results for applied load 30 and 50N are presented in Fig. 4 and 5. Roughness of all materials versus sliding distance at 30 and 50N applied loads are depicted in Fig. 6, 7 and 8 shows the SEM Observations after the experiment.
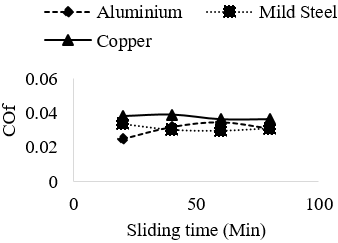
Frictional behavior: Figure 2 shows the coefficient of friction of all the metals (aluminium, mild steel and copper) at an applied load of 30 N. The measurement was taken at 4 different timings during the experiment. The graph is plotted with a coefficient of friction in the Y-axis and sliding time on the X-axis. The results show that the coefficient of friction is steady for all the materials especially for copper and mild steel. Aluminium exhibits slight variations during the experiment compared to other metals, which depicts the modification occurring at the asperities. Aluminium, being a light metal, was influenced at smaller loads. Previous studies and literature review suggest that the fluctuations in such frictional behavior occur because of transfer of materials from one surface to another (Sahin et al., 2007; Alidokht et al., 2012; Alotaibi et al., 2014a). Comparing the frictional values for all three metals, at 30N applied load, it is found that copper exhibit the highest friction coefficient than others.
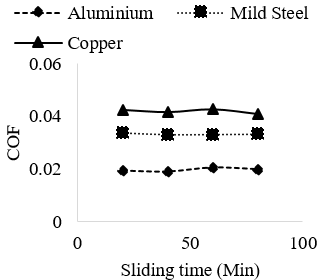
Figure 3 shows the coefficient of friction of aluminium copper and mild steel at an applied load of 50 N slidingagainst a stainless steel. The graph is plotted coefficient of friction in the Y-axis and sliding time in X-axis. Frictional coefficient of all the metals remains steady throughout the experiment. Aluminiumexhibits the lowest frictional coefficient while copper yields the maximum value. Unlike at 30N-applied load, here the steady-state is achieved right from the start of the experiment.
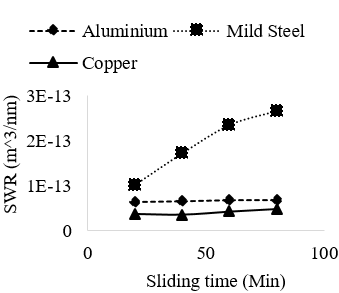
Wear characteristics: Specific wear rate of all three materials, Aluminium, Mild steel and copper, on their sliding time, under different load conditions, are presented in the following section.
Figure 4 gives the specific wear rate for all the materials for a different sliding time under 30N-applied load. The graph suggests that the specific wear rate of mild steel is linearly increasing with sliding time, while the specific wear rate of copper has a steady relationship with time. Aluminium exhibits a linear relationship during the first stage of the process but later tends to achieve a steady stage. As explained in Lee et al., (2009), the behavior of metals can be classified into two types. The first stage of the process in aluminium represents running-in-stage, where the interaction of the two metals does not have intimate contact as it is in the initial stage. However, as the process continues for a longer period, the metals adapt to the rubbing process and the intimate contact is achieved. This might be the reason for the steady wear rate of Aluminium during the later stages. Copper, on the other hand, shows the minimum specific wear rate. In the previous section, it was specified that the weight loss of copper was less under 30N load. The load must be insufficient to remove the material from the surface or to create high wearing conditions. This might be the reason for the minimum specific wear rate of copper under 30N. This argument is justified by Alotaibi et al., (2014b).
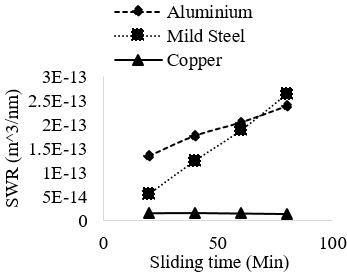
Figure 5 shows the variation of specific wear rate with respect to sliding time under the influence of applied load of 50N. The specific wear rate of aluminium and copper is steady right from the start. Aluminium achieved a steady-state much more quickly than in the case of 30N. The reason for this is the faster adoption of the surface of the two materials. Aluminium, being a light metal is easily influenced by the increase in applied load. The study conducted by Prakash et al., (2017) validates this argument through their findings. Mild steel shows high SWR compared to other materials since the material removal rate high. The relationship of SWR against sliding time is linear towards the initial stages, which tends to accomplish the steady-state towards the final stages. The assumption is that further sliding wearing of mild steel constant. Relatively light metals often exhibit this trend, as it does not cause any modification to the counter body during dry sliding as reported by many studies (Dwivedi, 2010; Ruiz-Andrea et al., 2015).
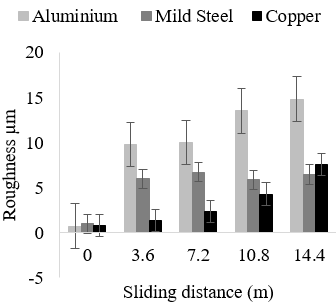
The roughness of the specimen and the counterface were measured at regular intervals. Figure 6 shows the variation of the roughness of the material surface at different sliding distances at an applied load of 30N. It is seen that the roughness of the specimen increases with sliding distance. Among the three metals, aluminium exhibits the highest roughness at a given load. It is evident that the roughness in the case of aluminium is steadily increasing. The formation of chips and lack of intimacy with the counterface might be the reason for this high roughness factor. This can be verified and studied further with the help of SEM. From the graph, mild steel has a steady roughness all around the rubbing process comparing to other metals. This is a proof for the intimacy between mild steel and stainless steel during the dry sliding process. However, the material removal rate of mild steel was high compared to other metals even if the roughness was less than that of aluminium. Many researchers find this as a result of material transfer from mild steel to the counterface. Sarmadi et al., (2013) SEM observations of mild steel can reveal further details about the nature of the surface roughness. On the other hand, copper exhibits very less surface roughness compared to the other two metals initially. But as the rubbing process achieved a maturity state, we can see that the roughness of the material surface increased.
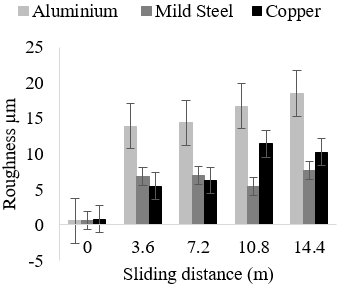
A similar pattern as that of 30N is observed when the applied load is changed to 50N (Fig. 7). Aluminium produces extreme roughness. The increase in load significantly affected the surface forces exerted on the material which in turn might have caused excessive roughness on the surface of the aluminium. Further, it shows that copper had a significant increase in roughness of the surface. Formation of debris during the running process might have contributed to this increase in roughness. This could be explained with surface morphology analysis using SEM.
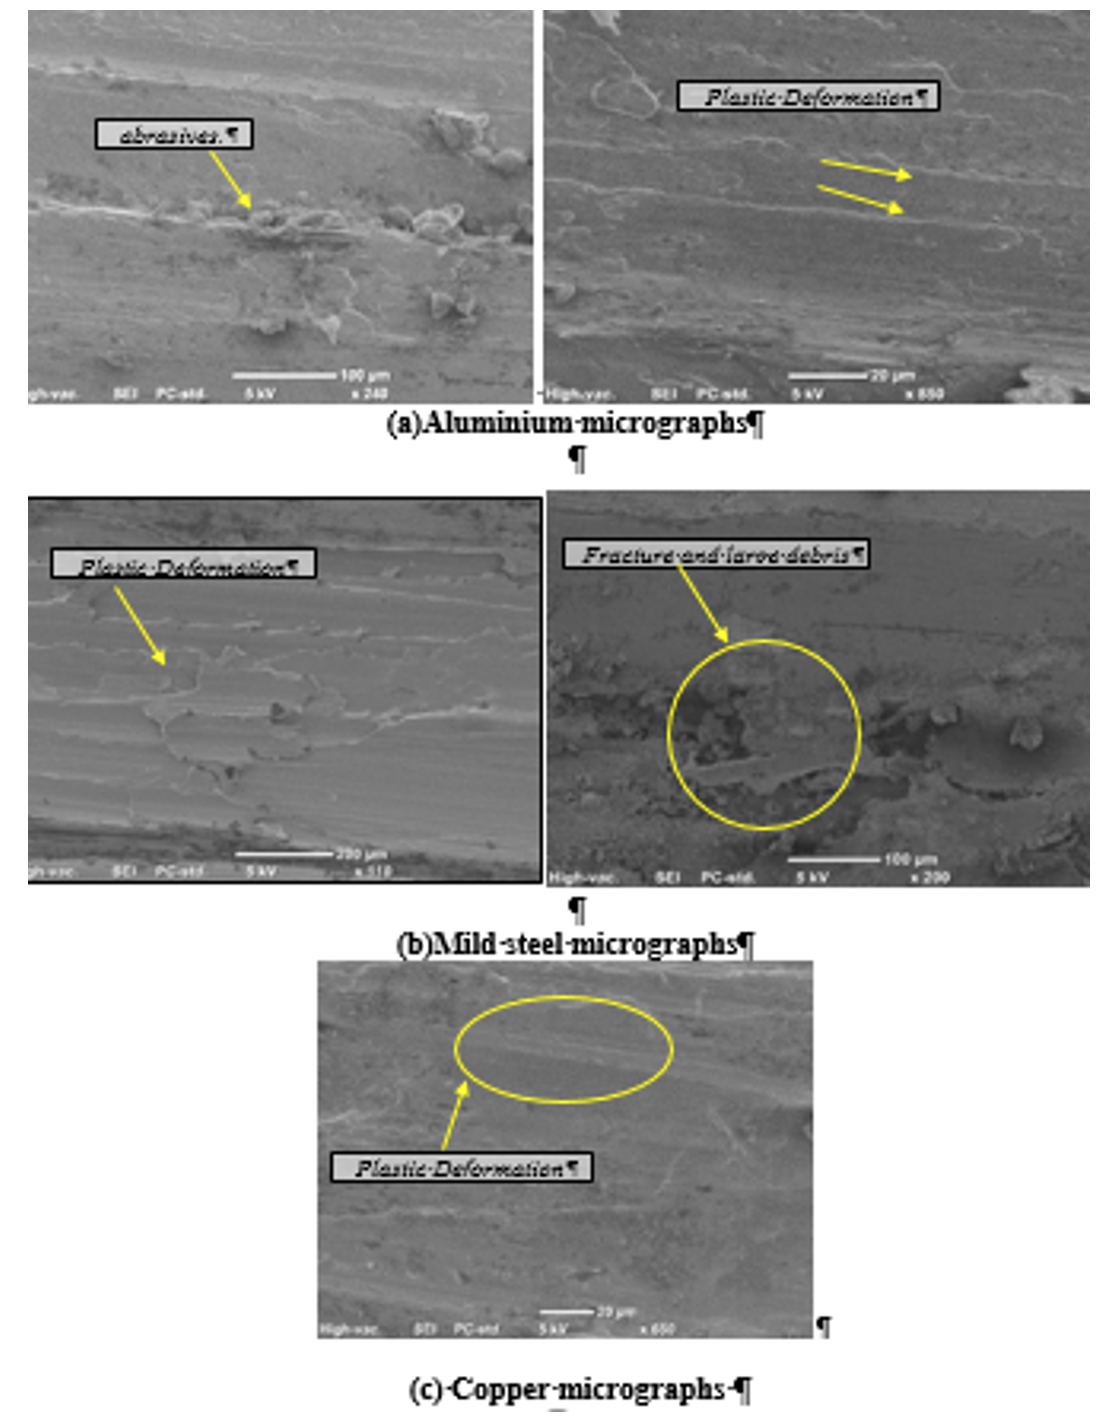
SEM observation of worn surfaces: In the previous section, it has been found that the mild steel exhibited the highest specific wear rate compared to aluminium and copper. Figure 8 display the micrographs of the worn surfaces of all the materials. There are different wear mechanisms observed on the metal surfaces of each metal. In the mild steel, a clear abrasive nature and ploughing process took place during the sliding which can explain the high material removal from the surface. Aluminium worn surface in Fig. 8a shows the combination of the adhesive and abrasive wear mechanisms with plastic deformation. This gives aluminium a bettered wear behavior compared to mild steel. On the other hand, copper showed only adhesive wear and it seems it has the lowered material removal compared to the aluminium and the mild steel. Due to high resistance of copper, there is high resistance to the shear in the interface which can result in high friction as experimentally given in Fig. 8. Meanwhile, aluminium showed low friction with intermediate wear behavior which can be explained with the aid of the micrographs which exhibited the combination of the adhesive and abrasive wear.
Conclusion
The study was conducted on adhesive wear and frictional behavior of aluminium, mild steel and copper sliding against a stainless steel counterface under dry contact conditions. The key findings of the experiments and recommendations can be listed as follows:
- The different operating parameters have a significant influence on the frictional behavior and wear performance of the metals. Under the influence of all applied loads, steady-state was achieved after a sliding distance 6km, which gave consistent values for specific wear rates and frictional co-efficient.
- Copper exhibits better wear performance at all applied load compared to mild steel and aluminium even though the frictional co-efficient of copper is high. Mild steel was more prone to wearing among three metals.
- SEM revealed three different wear mechanisms. Mild steel exhibited a combination of abrasion and ploughing process, Aluminium showed a combination of adhesive and abrasive wear while copper had only adhesive wear.
- Further research has to be done to find the influence of temperature at the contact surfaces of copper for better understanding of the project.
Author Details
1Department of Automotive and Marine Engineering Technology, Public Authority for Applied Education and Training, Kuwait
2Faculty of Health, Engineering and Sciences, University of Southern Queensland, Toowoomba, QLD, Australia
References
Alotaibi, J.G., B.F. Yousif and T.F. Yusaf, 2014a. Wear and frictional behaviour of metals. Adv. Mater. Res., 893: 430-435.
Alotaibi, J.G., B.F. Yousif and T.F. Yusaf, 2014b. Wear behaviour and mechanism of different metals sliding against stainless steel counterface. P. I. Mech. Eng. J-J. Eng., 228(6): 692-704.
Dwivedi, D.K., 2010. Adhesive wear behaviour of cast aluminium-silicon alloys: Overview. Mater. Design (1980-2015), 31(5): 2517-2531.
Kumar, M. and J. Bijwe, 2011. Composite friction materials based on metallic fillers: Sensitivity of μ to operating variables. Tribol. Int., 44(2): 106-113.
Lee, H., B. Park and H. Jeong, 2009. Mechanical effect of process condition and abrasive concentration on material removal rate profile in copper chemical mechanical planarization. J. Mater. Process. Tech., 209(4): 1729-1735.
Natarajan, N., S. Vijayarangan and I. Rajendran, 2006. Wear behaviour of A356/25SiCp aluminium matrix composites sliding against automobile friction material. Wear, 261(7-8): 812-822.
Prakash, K.S., T. Thankachan and R. Radhakrishnan, 2017. Parametric optimization of dry sliding wear loss of copper–MWCNT composites. T. Nonferr. Metal. Soc., 27(3): 627-637.
Prasad, B.K., 2011. Sliding wear response of a grey cast iron: Effects of some experimental parameters. Tribol. Int., 44(5): 660-667.
Ruiz-Andrea, M., A. Conde, J. de Damborenea and I. Garcia, 2015. Friction and wear behaviour of dual phase steels in discontinuous sliding contact conditions as a function of sliding speed and contact frequency. Tribol. Int., 90: 32-42.
Sahin, M., C.S. Çetinarslan and H.E. Akata, 2007. Effect of surface roughness on friction coefficients during upsetting processes for different materials. Mater. Design, 28(2): 633-640.
Sarmadi, H., A.H. Kokabi and S.M. Seyed Reihani, 2013. Friction and wear performance of copper–graphite surface composites fabricated by friction stir processing (FSP). Wear, 304(1-2): 1-12.
Tewari, A., 2012. Load dependence of oxidative wear in metal/ceramic tribocouples in fretting environment. Wear, 289: 95-103.
Yousif, B.F., 2013. Editorial for SI: Materials, design and tribology. Mater. Design, 48: 1.
Rights and permissions
Open Access: This article is licensed under a Creative Commons Attribution 4.0 International License, which permits use, sharing, adaptation, distribution and reproduction in any medium or format, as long as you give appropriate credit to the original author(s) and the source, provide a link to the Creative Commons license, and indicate if changes were made. The images or other third-party material in this article are included in the article’s Creative Commons license, unless indicated otherwise in a credit line to the material. If material is not included in the article’s Creative Commons license and your intended use is not permitted by statutory regulation or exceeds the permitted use, you will need to obtain permission directly from the copyright holder. To view a copy of this license, visit http://creativecommons.org/licenses/by/4.0/
Cite this Article
Ayedh Alajmi, Year. Tribological Characteristics of Commercial Metals. Research Journal of Applied Sciences, Engineering and Technology 17: 122-128 http://doi.org/10.19026/rjaset.17.5651
Received
Accepted
Published
March 2, 2020
April 27, 2020
August 25, 2020
DOI: http://doi.org/10.19026/rjaset.17.5651