Auvinet, G.G. and R.J.F. Rodriguez, 2017. Criteria for the design of friction piles subjected to negative skin friction and transient loads. Ing. Invest. Tecnol., 18(3): 279-292.
Studying the Effects of Pile Load on Negative Skin Friction in Basrah Governorate
Research Journal of Applied Sciences, Engineering and Technology 2021 18: 33-42
Cite This ArticleAbstract
The seriousness of the phenomenon of negative skin friction on piles penetrating Basrah soil in Iraq is investigated via the finite element method. The most common (0.285×0.285 m) precast driven and (0.8 m diameter) bored piles, are analyzed under the structural loads and down drag forces due to recent fill. A two-dimensional program adopting nonlinear constitutive relations for soil layers is utilized. The results revealed a great decrease in negative skin stress and pile length on which the phenomenon is to act upon, due to the application of structural loads. Reductions in drag forces as much as (86%) for driven piles and (96%) for bored piles are recorded in some sites. It is also concluded that, overlooking the negative skin friction does not result in failure and that more economical pile capacities could be adopted.
Keywords:
Introduction
Piles penetrating soft soils and resting on/into rock/dense sand are subject to loads in addition to the structural loads if the surrounding soil settles relatively to pile. The most common reason for ground settlement in Basrah is consolidation due to the application of recent fill.
Comodromos and Bareka, (2005) utilized a nonlinear three-dimensional finite element analysis (via ABAQUS) to study the effects of negative friction on a single pile embedded in a layered soil system. The analysis was extended to investigate the combined effect of negative skin friction and the pile's working load application. It was realized that a considerable reduction in negative skin friction could be achieved when the construction of the embankment preceded the structural load application, compared to the reverse construction sequence. Constructing the embankment after structural load application produced a negative friction force of about (50%) of the working load whereas, the reverse scenario produced an additional load of around (10%) of the working load. Leung, (2009) carried out an extensive experimental study by conducting centrifuge model tests at the National University of Singapore, to examine the behavior of single piles and pile groups subjected to simultaneous negative skin friction and working loads. It was demonstrated that the application of large structural loads neutralized the negative skin friction when soil settlement ceased under working conditions. Hong, (2013) studied the negative skin friction on single piles due to the placement of surface fill, in Singapore. Two-dimensional finite element formulation was utilized to investigate the influence of the magnitude of the pile structural load and time from the start of soft soil consolidation to the pile structural load application, as that represented the scenario of pile installation after the achievement of a considerable degree of consolidation, on the depth of neutral plane, the magnitude of total dragload and degree of negative skin friction mobilization. The results revealed reductions in the values of total drag loads and the degree of mobilization around (15%) when the pile was installed after a degree of consolidation of around (70%). For (90%) consolidation, reductions in mobilization degree were (>40%) for a penetration ratio of (11 and 21) and around (70%) for a penetration ratio of (41). The position of the neutral plane was not sensitive to the variation in the degree of consolidation of the surrounding soft ground. It was found that the total drag load, degree of mobilization, and neutral plane depth were inversely proportional to the pile’s-imposed load. Reductions were more significantina slender pile(of penetration ratio = 41) than a stocky pile (of penetration ratio = 11). Drbe et al. (2016) utilized the finite element method via Plaxis-2D to investigate negative skin friction on driven concrete piles and to study the effects of pile length and pile load on the location of the neutral plane. The results revealed decreased negative skin friction and neutral point depth, due to pile vertical load increase. Auvinet and Rodriguez, (2017) studied the behavior of friction piles embedded into a typical soil profile in Mexico City. A single pile was analyzed under negative skin friction and transient (seismic or wind) loads, using the finite element method via (Plaxis-2D) program. It was concluded that, considering transient loads in pile design dispensed of including the effect of negative skin friction. It was also demonstrated that the position of neutral level depended on the initial pile's loading conditions, and it was stabilized with the increased degree of consolidation.
The main objective of the present study is to assess the seriousness of the phenomenon of negative skin friction on piles penetrating Basrah soil by examining the role of the pile's structural load in reducing the drag force. The approach is as follows:
- Selecting backfilled project sites and providing their site investigation reports.
- Predicting the ultimate pile capacities via the static approach (Bowles, 1997), disregarding the negative skin friction phenomenon.
- Performing the analyses for the soft soil consolidation under the fill and pile's structural load as it is gradually and simultaneously applied during the consolidation process, to evaluate the drag forces transferred to the piles.
Materials And Methods
Finite element analysis: Transforming the square pile section into an equivalent circular one of the same perimeters, an axisymmetric finite element modeling to simulate the behavior of single piles is considered in this study. The discretized coupled flow equations in two dimensions are expressed as (Smith and Griffiths, 2004):
$ [K_m]\{u\} + [c]\{u_w\} = \{f\}, \ [c]^T \Big\lbrace\dfrac{du}{dt}\Big\rbrace - [K_c]\{u_w\} = \{0\} ~~~~~~~~~~~~~~~~~~~~~~~~ (1)$
where,
{u}, {uw}, and {f} : The nodal displacement, excess pore water pressure, and external loading vectors, respectively
[km] and [kc] : The stiffness and fluid conductivity matrices, respectively
[c] : A rectangular coupling matrix consisting of terms of the form:
$ \iint \dfrac{\partial N_i}{\partial x} N_j .dx.dy ~~~~~~~~~~~~~~~~~~~~~~~~~~~~~~~~~~~~~~~~~~~~~~~~~~~~~~~~~~~~~~~~~~~~~~~~~~~~~~~~~~~~~~~~~~~ (2)$
where the $N_i$ terms are the shape functions.
Pile properties: Two common pile types, (285×285 mm) precast reinforced concrete driven and (800 mm diameter) bored cast-in-situ piles are utilized. The properties are listed in Table 1.
In situ soil properties: Three sites are chosen to conduct the study: Umm-Qasr Port; Khor Al-Zubair; and Shatt Al-Arab Hotel. The soil properties for the sites are listed in Table 2 to 4.
Predicting the piles' structural loads: The maximum applied structural loads will be considered equal to the allowable pile capacities. Those values are predicted disregarding the phenomenon of negative skin friction. The ultimate and allowable bearing capacities are calculated as (Bowles, 1997):
$ Q_u = Q_p + Q_s $
For driven piles:
$ Q_a = \dfrac{Q_u}{F_s} $
For bored piles:
$ Q_a = \dfrac{Q_p}{F_1} + \dfrac{Q_s}{F_2} $
where,$ \begin{aligned} Q_u & : \text {Ultimate pile capacity in compression} \\ Q_p & : \text {Ultimate point capacity} \\ Q_s & : \text {Skin resistance} \\ Q_a & : \text {Allowable pile capacity} \\ F_s & : \text {Safety factor} = 4 \\ F_1 & : \text {Safety factor} = 3 \\ F_2 & : \text {Safety factor} = 1.5 \end{aligned} $
For piles driven into cohesive soils, the point bearing capacity can be expressed as:
$ Qp = Ap (c N's) $
where,
$ \begin{aligned}
c & : \text { Cohesion (or undrained shear strength)} \\
N'c & : \text { Bearing capacity factor adjusted for the effects of shape and depth} ≈ 9
\end{aligned} $
For driven piles into cohesionless soils, Meyerhof (1976), and Meyerhof and Sastray (1985) proposed an empirical equation, based the results of the Standard Penetration Test (SPT):
$ Qp = 40 \times N \times \dfrac{L_b}{B} \times Ap \le 400 \times N \times Ap ~~~~~~~~~~~~~~~~~~~~~~~~~~ (kN) $
where,
$ \begin{aligned}
N & : \text { Average corrected standard penetration number for the influence zone around the pile point} \\
B & : \text { Width or diameter of the pile point} \\
L_b & : \text { Pile penetration into the bearing stratum}
\end{aligned} $
For bored piles into cohesive soils:
$ Qp = q_p Ap $
$ q_p = N'c.c_u \le 40tsf $
$ N'c = 6\Big[1 + 0.2 \dfrac{L_b}{B}\Big] \le 9 ~~~~~~~~~~~~~~~~~~~~~~~~~~ \text for \ cu > 0.25 \ tsf $
For bored piles into cohesionless soils, Reese and O’Neill, (1988) equation is used to estimate the point bearing resistance. It is based on a displacement of (5% pile dia.):
$ Qp = 0.6 \times N \times Ap $
where,
$ \begin{aligned}
Qp & : \text { In tons } \\
Ap & : \text { In the square foot }
\end{aligned} $
In general:
$ Q_s = \sum A_s.f_s$
where,
$ \begin{aligned}
A_s & : \text { Effective pile surface area on which } (f_s) \text { acts = Perimeter } (p) × \text { embedment increment } (ΔL) \\
ΔL & : \text { Increment of embedment length (to allow for pile shaft variations and soil stratification) } \\
\sum & : \text { Summation of contributions from several strata or pile segments } \\
f_s & : \text { Skin resistance per unit area (i.e., shear stress) } = α.c + k. \sigma _v. tan \delta \le 100 kPa \\
α & : \text { Adhesion factor } \\
k & : \text { Lateral earth pressure coefficient } \\
σ_v & : \text { Vertical stress } \\
δ & : \text { Friction angle between soil and pile material }
\end{aligned} $
For driven piles:
$ 1.0 \ge \alpha = 0.5 + 0.01 (75 - c) \ge 0.5 $
$ k $ = 1 for loose state; 2 for dense state
$ δ $ = 0.75 φ for concrete piles (Broms and Silberman, 1964)
For bored piles, the modified β-method of O’Neill and Hassan (1994) is used to estimate the resisting shear stress (fs) along a pile shaft embedded in cohesionless soil as:
$ fs = \beta \times \sigma ^{'}_{0av} \lt 2 ~~~~~~~~~~~~~~ \text (tsf) \ for \ 0.25 \le \beta \le 1.2 $
$ \beta = 1.5 - 0.135 \times Z^{0.5} ~~~~~~~~~~~~~~ \text (Z \ in \ ft) \ for \ N \gt 15 $
$ \beta = \dfrac {N}{15} (1.5 - 0.135 \times Z^{0.5}) ~~~~~~~~~~~~~~ \text (Z \ in \ ft) \ for \ N \le 15 $
For bored piles in cohesive soils, adhesion factors of (0.55) is assumed for (su <2 tsf) and of (0.49) for (su = 2-3 tsf).
The allowable capacities of (i.e., the maximum structural loads on) the precast and bored piles are listed in Table 5.
| Pile type | Section dimension (s) | E (MPa) | v |
|---|---|---|---|
| Precast driven | 285×285 mm | 29700 | 0.2 |
| Bored | 800 mm in dia | 24870 | 0.2 |
| Material | Fill | Medium stiff 1 | Medium stiff 2 | Dense/very dense sand |
|---|---|---|---|---|
| Depth of layer (m) | -3-0 | 0-7.50 | 7.5-14.5 | 14.5-20 |
| Material model | Mohr-C | SSM | SSM | Mohr-C |
| Drainage type | Drained | Drained | Drained | Drained |
| Unit weight, $\gamma, \gamma_{sat} (kN/m^3)$ | 18, 20.30 | 16, 18 | 16, 18 | 18.6, 20.4 |
| Initial void ratio, init | 0.50 | 0.85000 | 0.85000 | 0.40 |
| Stiffness modulus, E (MPa) | 48 | 3.50000 | 2.50000 | 57.60 |
| Effective cohesion, c' (kPa) | 1 | 3 | 3 | 1 |
| Effective friction angle, $ϕ'$ (0) | 36 | 27 | 31 | 40 |
| Dilatancy angle, $ѱ$ (0) | 6 | 0 | 1 | 10 |
| Permeability, k (m/day) | 4.32 | 0.00086 | 0.00086 | 4.32 |
| Interface strength, Rinter | 0.70 | 0.70000 | 0.70000 | 0.70 |
| Poisson's ratio, v | 0.27 | 0.40000 | 0.40000 | 0.30 |
| Compression index (Cc) | 0.25000 | 0.25000 | ||
| Recompression index (Cr) | 0.03000 | 0.03000 |
| Material | Fill | Loose silty sand | Medium stiff clay | Very stiff clay | Very dense sand |
|---|---|---|---|---|---|
| Depth of layer (m) | -3-0 | 0-1 | 1-10 | 10-17 | 17-25 |
| Material model | Mohr-C | Mohr-C | SSM | SSM | Mohr-C |
| Drainage type | Drained | Drained | Drained | Drained | Drained |
| Unit weight, $\gamma, \gamma_{sat} (kN/m^3)$ | 18, 20.30 | 16.5-20 | 15.6-19.4 | 15.6-19.4 | 19.4-21.5 |
| Initial void ratio, init | 0.50 | 0.610 | 0.610 | ||
| Stiffness modulus, E (MPa) | 48 | 11.70 | 30 | 62.700 | 60 |
| Effective cohesion, c' (kPa) | 1 | 1 | 5.700 | 14.700 | 1 |
| Effective friction angle, ϕ' (0) | 36 | 31.80 | 23 | 20 | 40 |
| Dilatancy angle, ѱ (0) | 6 | 2 | 0 | 0 | 9 |
| Permeability, k (m/day) | 4.32 | 1 | 0.001 | 0.001 | 4.32 |
| Interface strength, Rinter | 0.64 | 0.65 | 0.810 | 0.850 | 0.66 |
| Poisson's ratio, v | 0.27 | 0.20 | 0.300 | 0.240 | 0.30 |
| Compression index (Cc) | 0.200 | 0.200 | |||
| Recompression index (Cr) | 0.027 | 0.027 |
| Material | Fill | Very stiff slit | Medium stiff slit | Medium stiff slit | Dense to very dense sand |
|---|---|---|---|---|---|
| Thickness (m) | -3-0 | 0-1.50 | 1.5-22 | 22-25 | 25-30 |
| Material model | Mohr-C | Mohr-C | SSM | Mohr-C | Mohr-C |
| Drainage type | Drained | Drained | Drained | Drained | Drained |
| Unit weight, $\gamma, \gamma_{sat} (kN/m^3)$ | 18, 20.30 | 15.9, 18.9 | 14.7, 19.3 | 15.7, 19 | 19.9, 22.7 |
| Initial void ratio, init | 0.890 | ||||
| Stiffness modulus, E (MPa) | 48 | 12.800 | 4.400 | 6.800 | 60 |
| Effective cohesion, c' (kPa) | 1 | 12 | 2.800 | 5 | 1 |
| Effective friction angle, ϕ' (0) | 36 | 24.500 | 26 | 24 | 40 |
| Dilatancy angle, ѱ (0) | 6 | 0 | 0 | 0 | 10 |
| Permeability, k (m/day) | 4.32 | 0.002 | 0.002 | 0.002 | 4.32 |
| Interface strength, Rinter | 0.64 | 0.820 | 0.670 | 0.820 | 0.66 |
| Poisson's ratio, v | 0.27 | 0.300 | 0.340 | 0.340 | 0.27 |
| Compression index (Cc) | 0.190 | ||||
| Recompression index (Cr) | 0.022 |
| 0.285×0.285 m driven pile | 0.8 m diameter bored pile | |||
|---|---|---|---|---|
| Site | Pile penetration (m) | Max. load (kN) | Pile penetration (m) | Max. load (kN) |
| Umm-Qasr port | 16.0 | 370 | 16.5 | 1150 |
| Khor Al-Zubair | 11.5 | 210 | 12.0 | 750 |
| Shatt Al-Arab hotel | 26.5 | 550 | 27.0 | 1530 |
| Max.: Maximum | ||||
Results
It is assumed that the structural load is applied after fill completion and increases linearly with the construction period of (2 years). The loading strategy is illustrated in Table 6.
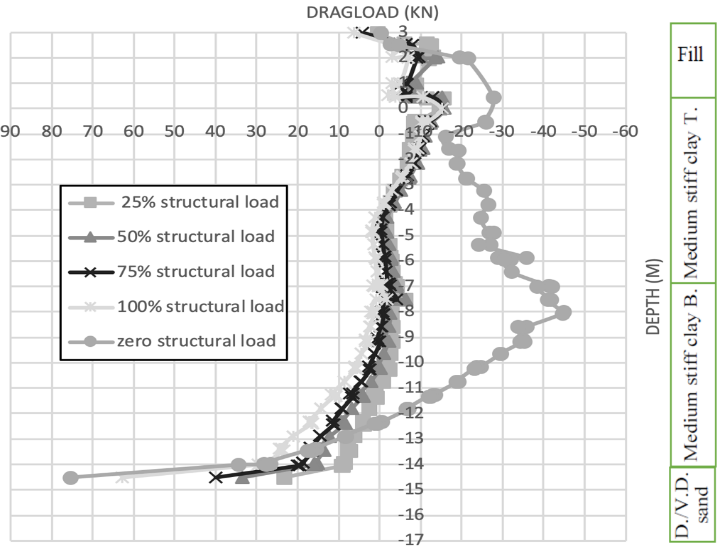
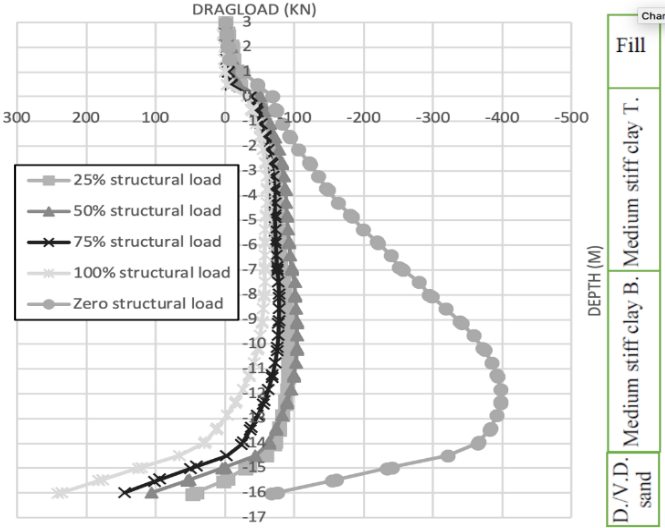
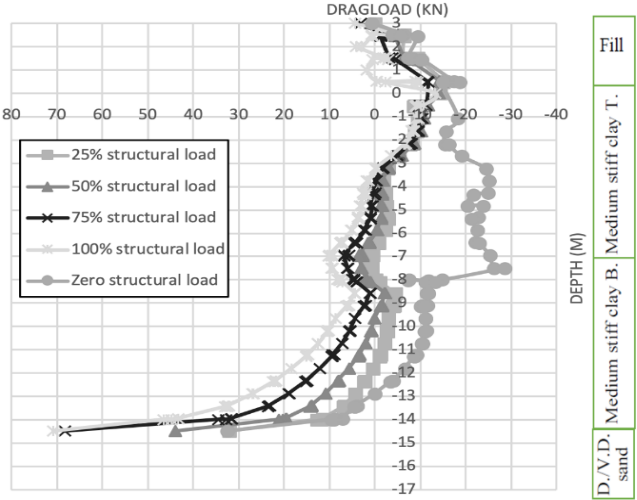
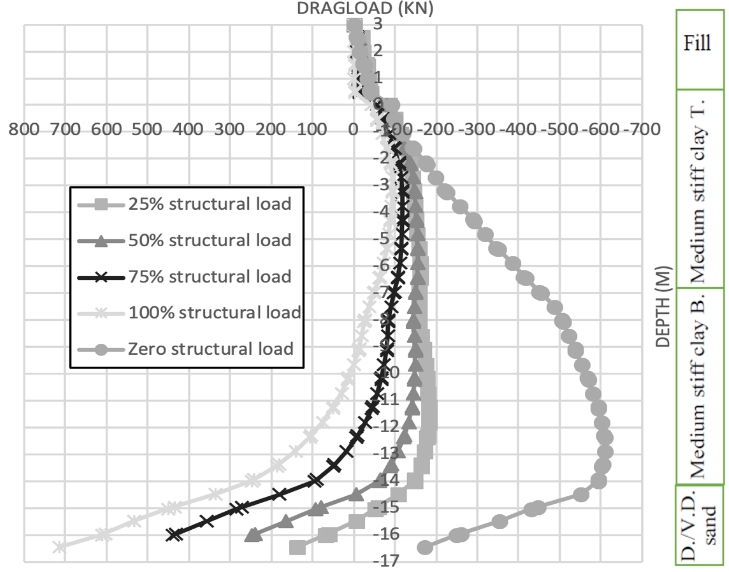
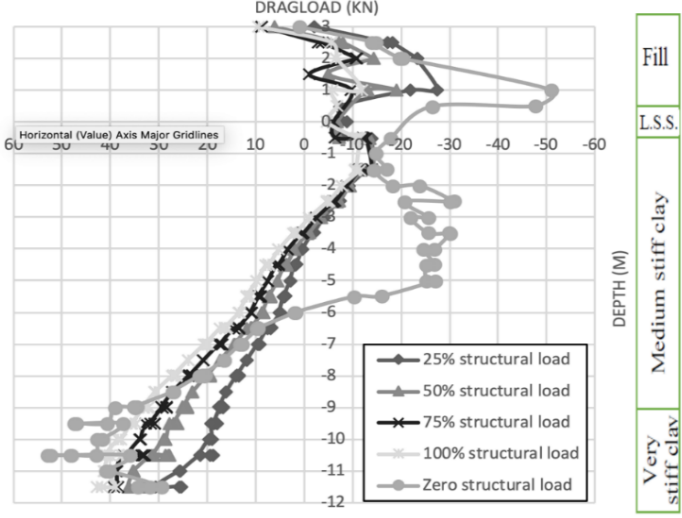
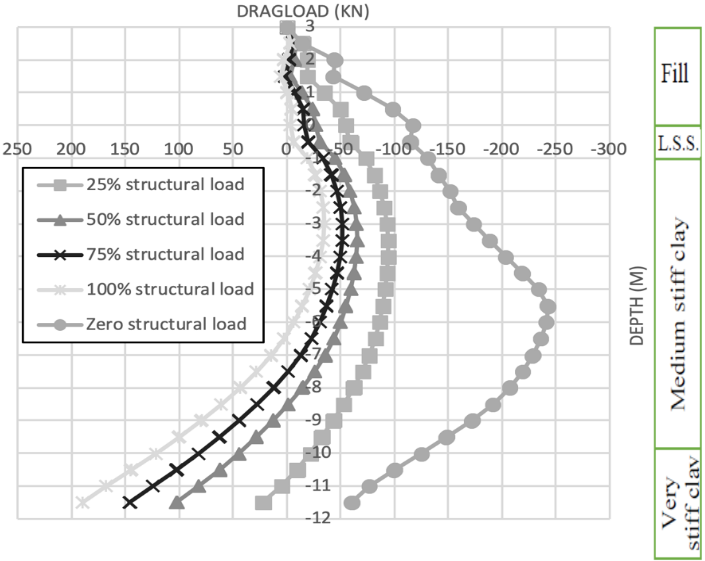
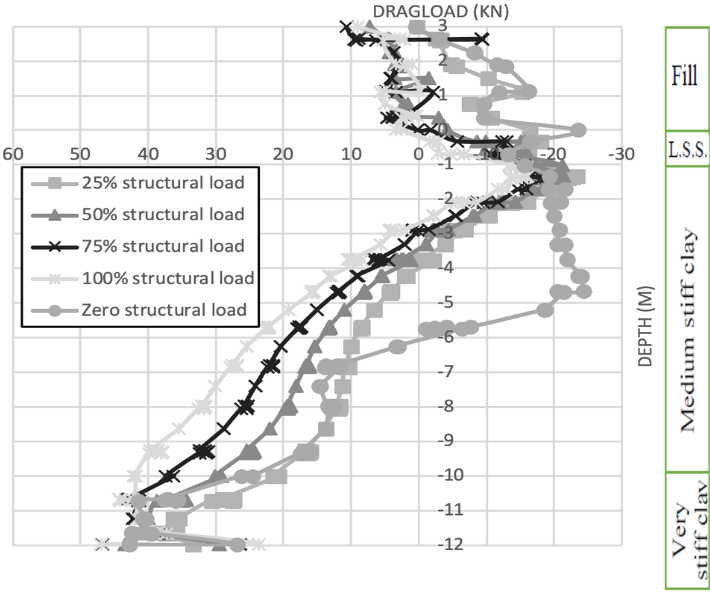
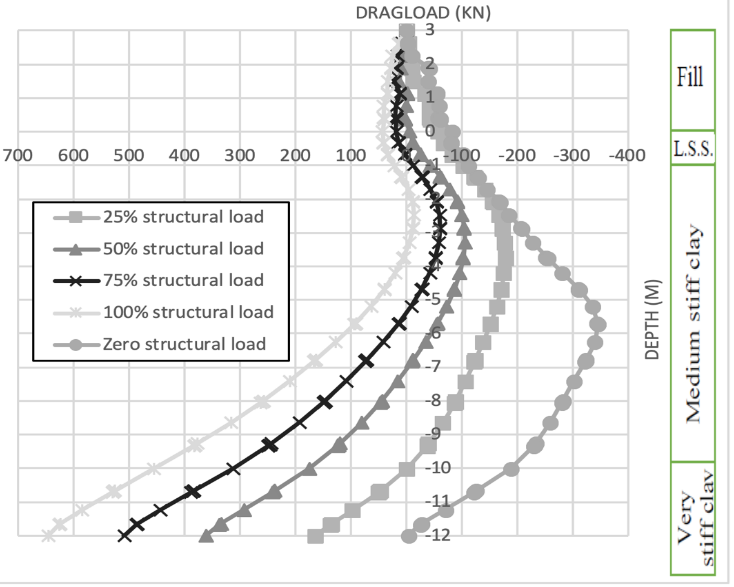
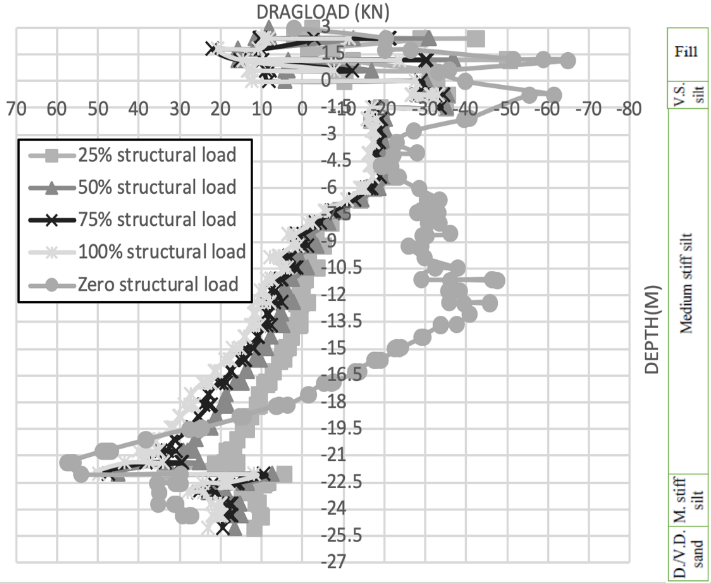
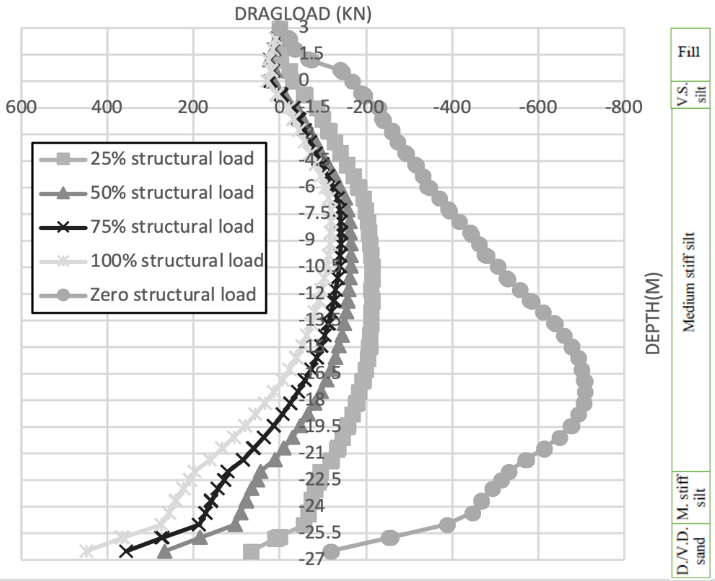
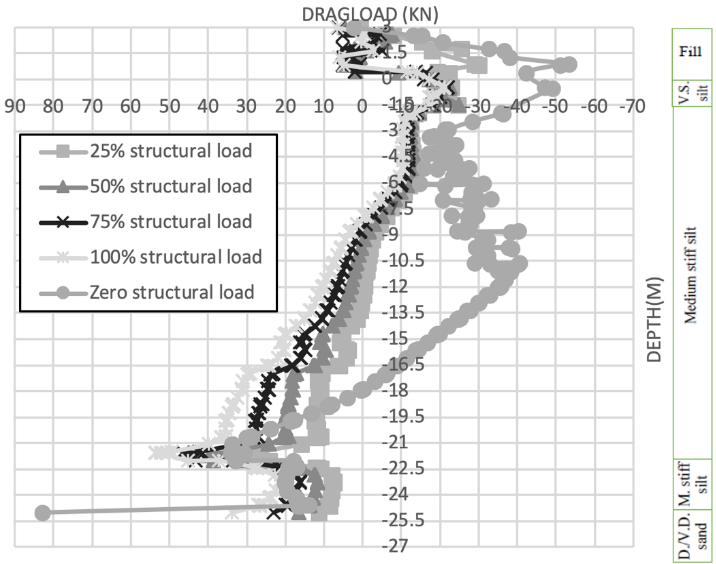
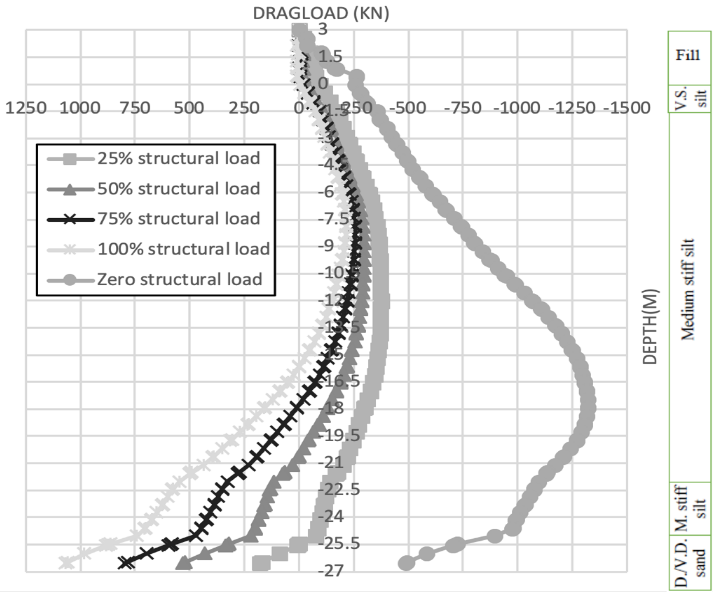
The effects of the applied loads on skin friction stresses and drag loads are shown in Fig. 1 to 4 forUmm Qasr Port. The effect of the pile loads on skin friction and drag loads are shown in Fig. 5 to 8 for the Khor Al-Zubair site. The effects of the applied loads on the behavior are shown in Fig. 9 to 12 for the Shatt Al-Arab Hotel.
The depth-dragload curves are more stable than their counterparts for skin friction stress, where the pile behavior under negative skin friction and structural load is clearer. When the pile structural load is considered, curve peaks are less distinctive. In general, the drag load and neutral point depth are inversely proportional to the pile structural load.
| Umm-Qasr port | Khor Al-Zubair | Shatt Al-Arab hotel | |||||
|---|---|---|---|---|---|---|---|
| Time (year) | (%) of Max. load | 0.285 m side driven pile | 0.8 m diameter bored pile | 0.285 m side driven pile | 0.8 m diameter bored pile | 0.285 m side driven pile | 0.8 m diameter bored pile |
| 0.5 | 25 | 92.5 | 287.5 | 52.5 | 187.5 | 137.5 | 382.5 |
| 1.0 | 50 | 185 | 575 | 105 | 375 | 275 | 765 |
| 1.5 | 75 | 277.5 | 862.5 | 157.5 | 562.5 | 412.5 | 1147.5 |
| 2.0 | 100 | 370 | 1150 | 210 | 750 | 550 | 1530 |
| Max.: Maximum | |||||||
Discussion
The relative displacements between the ground surface and the pile are listed in Table 7. Great reductions are recorded due to pile penetration and elastic shortening under the applied loads.
The influence of the applied load onthe locationof the neutral point is illustrated in Table 8. Theneutral points are raised at all locations for both pile types.
The dragloads on both pile types, predicted at various structuralloads, are compared in Table 9 and 10.
The tabulated values reveal a great reduction in dragloads due to pile loads application. This reduction is attributed to the decrease in negative skin stresses and pile influence zone.
It should be mentioned that the effects of structural load application on the (dragload on) and (neutral point of) driven and bored piles penetrating Basra backfilled soil profiles, conform with the findings of previous works relating to the subject.
| 0.285×0.285 m driven pile | 0.8 m diameter bored pile | |||||
|---|---|---|---|---|---|---|
| Site | Zero | 50% | 100% | Zero | 50% | 100% |
| Umm-Qasr port | 0.034 | 0.0076 | 0.0073 | 0.060 | 0.0145 | 0.0143 |
| Khor Al-Zubair | 0.024 | 0.0055 | 0.0053 | 0.026 | 0.0028 | 0.0024 |
| Shatt Al-Arab hotel | 0.030 | 0.0038 | 0.0037 | 0.028 | 0.0037 | 0.0034 |
| Driven pile (%) of the Max. load | Bored pile (%) of the Max. load | ||||||
|---|---|---|---|---|---|---|---|
| Site | Zero | 100 | Zero | 100 | |||
| Umm-Qasr port | 12.0 | 3.7 | 12.9 | 3.2 | |||
| Khor Al-Zubair | 5.9 | 3.2 | 6.2 | 2.8 | |||
| Shatt Al-Arab hotel | 17.7 | 8.3 | 17.9 | 8.2 | |||
| Max.: Maximum | |||||||
| (%) of the Max. applied load | |||||||
|---|---|---|---|---|---|---|---|
| Site | Zero | 25 | 50 | 75 | 100 | ||
| Umm-Qasr port | Dragload | 379 | 88 | 104 | 77 | 58 | |
| (%) of the Max. dragload | 100 | 22 | 26 | 19 | 15 | ||
| Khor Al-Zubair | Dragload | 243 | 94 | 65 | 51 | 34 | |
| (%) of the Max. dragload | 100 | 39 | 27 | 21 | 14 | ||
| Shatt Al-Arab hotel | Dragload | 708 | 213 | 160 | 125 | 118 | |
| (%) of the Max. dragload | 100 | 30 | 23 | 18 | 17 | ||
| Max.: Maximum | |||||||
| (%) of the Max. applied load | |||||||
|---|---|---|---|---|---|---|---|
| Site | Zero | 25 | 50 | 75 | 100 | ||
| Umm-Qasr port | Dragload | 608 | 182 | 157 | 119 | 95 | |
| (%) of the Max. dragload | 100 | 30 | 26 | 20 | 16 | ||
| Khor Al-Zubair | Dragload | 345 | 178 | 106 | 62 | 14 | |
| (%) of the Max. dragload | 100 | 52 | 31 | 18 | 4 | ||
| Shatt Al-Arab hotel | Dragload | 1317 | 374 | 279 | 256 | 215 | |
| (%) of the Max. dragload | 100 | 28 | 23 | 19 | 16 | ||
| Max.: Maximum | |||||||
Conclusion
The following conclusions can be drawn from the adopted case studies when the applied pile structural loads are taken into consideration:
- The relative displacement is decreased, leading to reductions in negative skin stress and pile length on which the phenomenon is to act upon.
- No soil failure is detected during finite element analyses.
- The phenomenon of negative skin friction is not dangerous, and the geotechnical engineer is encouraged to adopt more economical pile capacities.
Conflict Of Interest
No potential conflict of interest is reported by the authors.
Author Details
1Department of Civil Engineering, College of Engineering, University of Basrah, Basrah, Iraq
References
Bowles, J., 1997. Foundation Analysis and Design. 5th Edn., The McGraw-Hill Companies Corp, New York, St. Louise, pp: 1168.
Broms, B.B. and J.O. Silberman, 1964. Skin friction resistance for piles in cohesionless soils. Sols-Soil., 10: 33-41.
Comodromos, E.M. and S.V. Bareka, 2005. Evaluation of negative skin friction effects in pile foundations using 3D nonlinear analysis. Comput. Geotech., 32: 210-221.
Drbe, O., A. Sadrekarimi, M.H. El Naggar and T. Sangiuliano, 2016. Modelling of negative skin friction on driven piles. Proceeding of 69th Canadian Geotechnical Conference (GeoVancouver, 2016), Vancouver, October 2-5, pp: 1-7.
Fugro Middle East, 2017. Geotechnical factual report, Umm Qasr Yard 5 terminal-draft report. Fugro Document No.: 16-013-IQ-2ER- BMT-F00.
Hong, G.B., 2013. Numerical study on negative skin friction on single piles. M.Sc. Thesis, Department of Civil Engineering, The National University of Singapore.
Leung, C.F., 2009. Negative skin friction on piles. Proceeding of Indian Geotechnical Conference. Guntur, India, pp: 827-836.
Meyerhof, G.G., 1976. Bearing capacity and settlement of pile foundations. J. Geotech. Eng-ASCE, 102(3): 197-228.
Meyerhof, G.G. and V.V.R.N. Sastray, 1985. Bearing capacity of rigid piles under eccentric and inclined loads. Can. Geotech. J., 22(3): 267-276.
O’Neill, M.W. and K.M. Hassan, 1994. Drilled shafts: Effects of construction on performance and design criteria. Proceeding of the International Conference on Design and Construction of Deep Foundations, 1: 137-187.
Petrolinvest, 2015. Geotechnical/Geophysical investigation report for common seawater supply project in Khour Al-Zubair. Petrolinvest Doc. No.: 2004-99-08-SU11-0028.
Reese, L.C. and M.W. O’Neill, 1988. Drilled Shafts: Construction and Design. FHWA, Publication No. HI-88-042.
Smith, I.M. and D.V. Griffiths, 2004. Programming the Finite Element Method. 4th Edn., John Wily and Sons, Chichester, pp: 646.
The University of Basra, Engineering Consulting Bureau, 2012. Soil investigation report for Shatt Al-Arab Hotel. Report No.: 44R/SI/2012.
Rights and permissions
Open Access: This article is licensed under a Creative Commons Attribution 4.0 International License, which permits use, sharing, adaptation, distribution and reproduction in any medium or format, as long as you give appropriate credit to the original author(s) and the source, provide a link to the Creative Commons license, and indicate if changes were made. The images or other third-party material in this article are included in the article’s Creative Commons license, unless indicated otherwise in a credit line to the material. If material is not included in the article’s Creative Commons license and your intended use is not permitted by statutory regulation or exceeds the permitted use, you will need to obtain permission directly from the copyright holder. To view a copy of this license, visit http://creativecommons.org/licenses/by/4.0/
Cite this Article
Haider S. Al-Jubair and Jasim M. Al-Battat, 2021. Studying the Effects of Pile Load on Negative Skin Friction in Basrah Governorate. Research Journal of Applied Sciences, Engineering and Technology 18: 33-42 http://doi.org/10.19026/rjaset.18.6062
Received
Accepted
Published
January 6, 2020
August 17, 2020
May 25, 2021
DOI: http://doi.org/10.19026/rjaset.18.6062