
Agba, D.S.I., 2009. Mesure d’activités volumiques du radon dans la commune de Cocody, DEA Matière-Modélisation-Rayonnement, Sciences et Techniques Nucléaires, UFR SSMT, Université Félix Houphouët-Boigny.
Survey of Gamma Dose Rate in Air Inside Some Dwellings of the Commune of Yopougon, Abidjan, Côte d’Ivoire
Research Journal of Applied Sciences, Engineering and Technology 2021 18: 79-85
Cite This ArticleAbstract
To determine the radon potential level and estimate the related exposure of the public, combined gamma dose rate and radon measurements were performed in 15 dwellings in Yopougon, the largest and inhabited commune ofCôte d’Ivoire. Indoor gamma dose rates were measured using a gamma survey meter. Radon concentration measurements were performed using LR-115 films detectors (SSNTDs) for three months. The mean indoor gamma dose rate in air was 20 nSv/h whereas the mean radon concentration indoor was found to be 93.04 Bq/m3. The relationship between indoor radon measurements and gamma dose rates was also investigated. A very weak correlation between the two variables was observed.
Keywords:
Introduction
Radon, a radioactive gas, is present in all buildings and underground locations as its immediate precursor, radium-226, is ubiquitous in the Earth’s crust. Radon is a significant source of radiation exposure of the public. Since it was recognized as a human lung carcinogen from epidemiological (WHO, 1986; IARC, 1988; ICRP, 1993) and pooled case-control studies of residential exposures(ICRP, 2010), comprehensive radon surveys in dwellings and workplaces, as well as management strategies, were implemented in many countries through national radon programs. Combined studies of gamma dose rate and radon concentration inside houses (Sundal and Strand, 2004; Iqbal et al., 2012; Clouvas et al., 2013; Quarto et al., 2016) were also carried out. In general, a weak correlation was found between these two variables (Sundal and Strand, 2004; Clouvas et al., 2013; Quarto et al., 2016).
As Côte d’Ivoire is a non-nuclear country, the study of environmental radioactivity is recent. Therefore, there is no natural radiation mapping and not even national reference level. Environmental radioactivity investigation began with the measurement of radionuclides in the soil by alpha and gamma spectrometry (Koua et al., 2009a) as well as the estimation of the gamma dose rate outdoor (Koua et al., 2009b). The ambient gamma dose rate outdoor was also measured in Abobo, another commune of the district of Abidjan where the average value found was 10 nGy/h (Kouadio, 2008).
In order to broaden this systematic survey of the exposure to natural radiation, radon concentration study using Solid State Nuclear Tracks Detectors (SSNTD) was initiated. In this context, various measurements of radon in homes were conducted, notably in the district of Abidjan (Agba, 2009; Agba et al., 2015; N’guessan, 2014; N’guessan et al., 2016; Nonka, 2015; Vanié, 2015). The aim of these measurements was to determine the radon potential level and estimate the related exposure of the public in this district, which alone shelters 33% of the population living in Côte d’Ivoire.
In this study, we present the results of a pilot study. Measurements were carried out in 15 houses located in Yopougon (Nonka, 2015; Vanié, 2015) and the correlation between gamma dose rate and radon concentration in these dwellings was discussed.
Materials And Methods
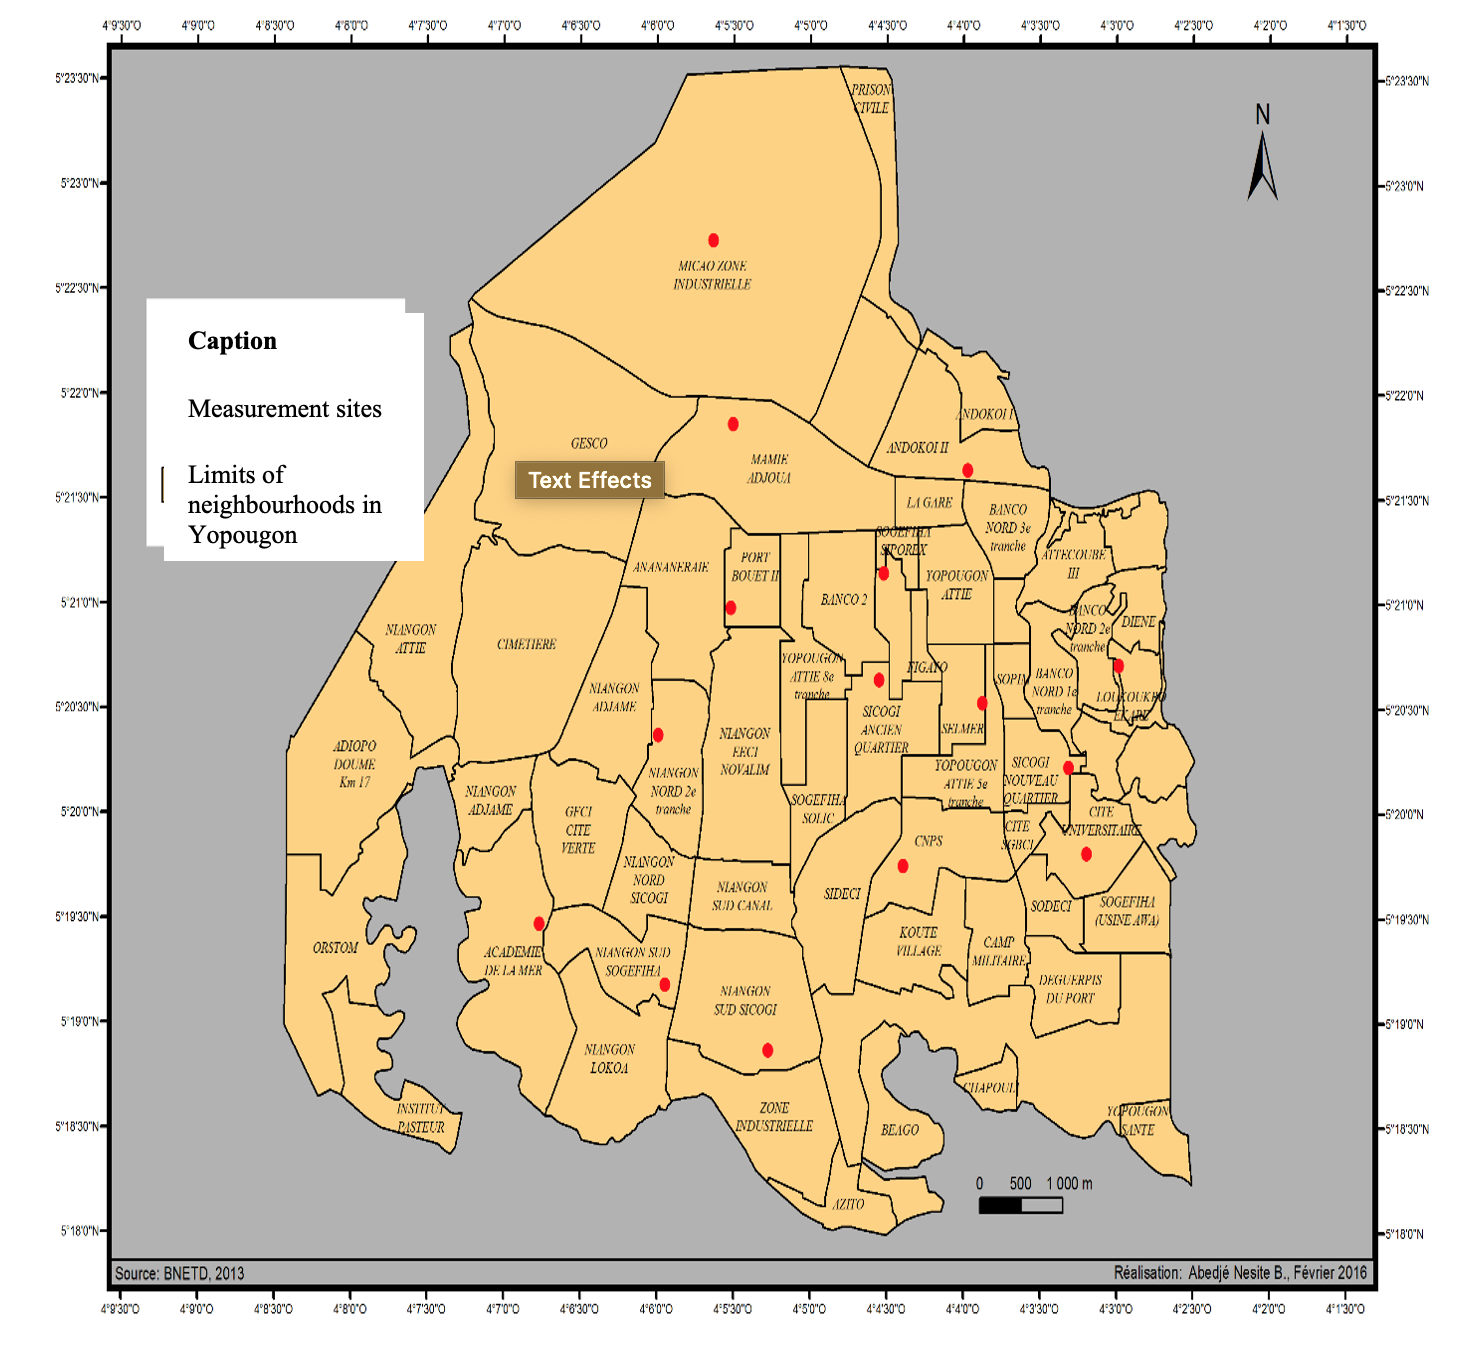
Study area: The area of this study is Yopougon which lies in the North-West part of the District of Abidjan, between the latitudes 5°20’56ʺ N and longitudes 4`°00’56ʺ W. It is the largest and one of the most inhabited communes of Côte d’Ivoire.
The climate is divided in four distinct seasons: a long dry season (from December to April), a heavy rainy season (from April to July), a small dry season (from July to September) and a small rainy season (from October to December). The temperature varies from 22 to 35°C with a mean about 28°C. The mean moisture is 90%. The geology of the commune is formed of sedimentary rocks from tertiary to quaternary age.
Fifteen dwellings were selected throughout the commune and thesites werelocatedusing a GPS (Fig. 1). The basic information on the sites is given in Table 1.
The surveys are performed at the same period and at the same location during the small rainy season, from September to November 2015.
Indoor Gamma dose rates and radon measurements: The indoor gamma dose rate measurements in the identified sites were carried out using a highly sensitive NaI scintillator-based gamma dosimeter (RadEye PRD, ThermoFisher, USA) at 1 m above the ground. Several readings were taken at different points in each area and the average gamma exposures were determined. This device can detect gamma rays in the energy range from 60 keV to 1.3 MeV and the dose rate measurement range is 0.01 to 250
The indigenous radon measurement sensor was composed of a non-strippable LR 115 type 2 film (Dosirad, France) cut into 2.5×2.5 cm2 and sticked on an envelope. The detectors were deployed inside the dwellings, away from windows and doors. After three months of exposure, the SSNTDs were retrieved for chemical etching in a 2.5 N NaOH solution bath at a temperature of 60°C during 120 min (Agba, 2009). The tracks recorded onto the film were counted using a digital imaging system which comprise an optical microscope and a CCD camera connected to a monitor, then converted to radon concentration.
Statistical analysis: The relationship between the indoor gamma dose rate and radon concentration was analyzed using the student’s t-test. The normality of the log transformed experimental data was tested by the KOLMOGOROV-SMIRNOV test.
| Sites | Code | GPS | Gamma dose rate |
Radon concentration |
|---|---|---|---|---|
| Siporex | SI | 21' 8.833" N | 30 | 81.9±1.7 |
| 4' 31.125" W | ||||
| Sicogi ancien quartier | AQ | 20' 38.298" N | 10 | 75.6±1.6 |
| 4' 32.988" W | ||||
| Selmer | SE | 20' 31.651" N | 10 | 101.6±1.2 |
| 3' 52.496" W | ||||
| Nouveau quartier | NQ | 20' 13.206" N | 30 | 106.5±1.5 |
| 3' 18.643" W | ||||
| Niangon sud sogefiha | NS | 19' 11.016" N | 30 | 66.8±1.9 |
| 5' 56.693" W | ||||
| Academie de la mer | AM | 19' 28.256" N | 20 | 80.4±1.7 |
| 6' 45.951" W | ||||
| Niangon sud sicogi | SS | 18' 52.215" N | 20 | 60.2±1.8 |
| 5' 16.360" W | ||||
| Cnps | CN | 19' 45.127" N | 20 | 95.4±2.3 |
| 4' 23.422" W | ||||
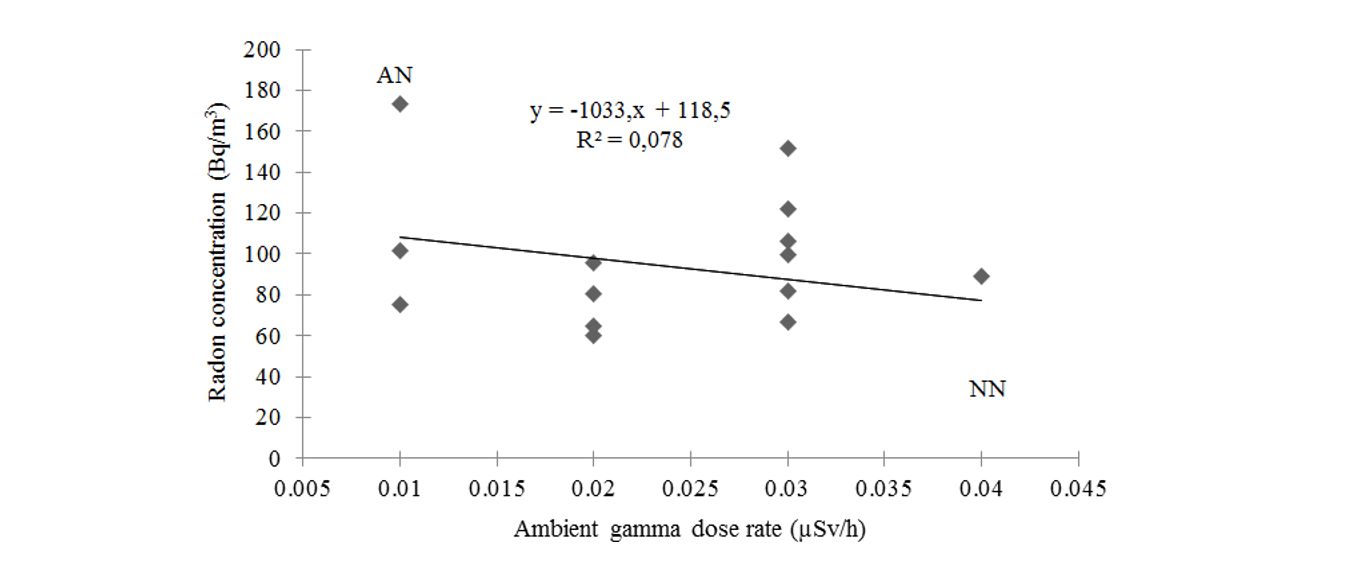
| Niangon nord | NN | 20' 22.419" N | 40 | 26.3±1.1 |
| 5' 59.453" W | ||||
| Mamie adjoua | MA | 21' 51.444" N | 40 | 89.4±1.5 |
| 5' 30.180" W | ||||
| Micao zone industrielle | ZI | 22' 44.040" N | 30 | 99.6±1.7 |
| 5' 37.978" W | ||||
| Andokoi II | AN | 21' 38.426" N | 10 | 173.3±1.5 |
| 3' 58.204" W | ||||
| Millionnaire | MI | 20' 42.519" N | 30 | 151.9±2.2 |
| 2' 59.063" W | ||||
| Toit rouge | TR | 19' 48.590" N | 20 | 64.9±1.6 |
| 3' 11.519" W | ||||
| Port bouet II | PB | 20' 58.859" N | 30 | 121.8±2.1 |
| 5' 31.039" W | ||||
| Range | 10 - 40 | 26.3-173.3 | ||
| Median | 25 | 89.4±1.5 | ||
| Arithmetic mean | 20 | 93.04 |
Results And Discussion
The results of indoor ambient gamma dose rates and indoor radon concentration were summarized in Table 1.
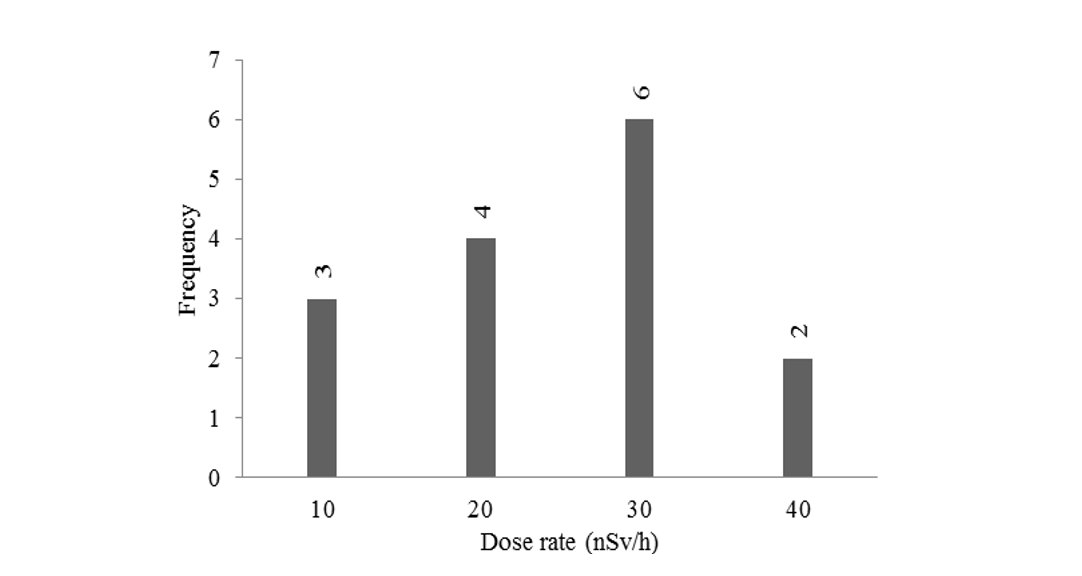
Indoor gamma dose rates: The gamma absorbed dose rates varies in the range 10-40 nSv/h, with a mean value of 20 nSv/h. The highest values, 40 nSv/h, are recorded on the sites MA, NN and the lowest at AQ, SE. The mean value observed in Yopougon (20 nSv/h) was very low compared to the average value, 229 nSv/h, obtained in the Province of Naples (Quarto et al., 2016). In this region of Italy, materials which are very rich in uranium and thorium traces are widely used in house construction. This make the natural radiation exposure particularly significant whereas buildings in Yopougon were made of sand and cement. Moreover, Yopougon lies on the sedimentary costal area which was reputed to have low natural background radiation exposure.
The mean dose rates were also lower than the world average value (46.8 nSv/h) of the normal background area (UNSCEAR, 2000).
Figure 2 shows the frequency distribution of gamma dose rate in air inside the monitored dwellings. The experimental gamma radiation dose rate data indicates a normal-like distribution.
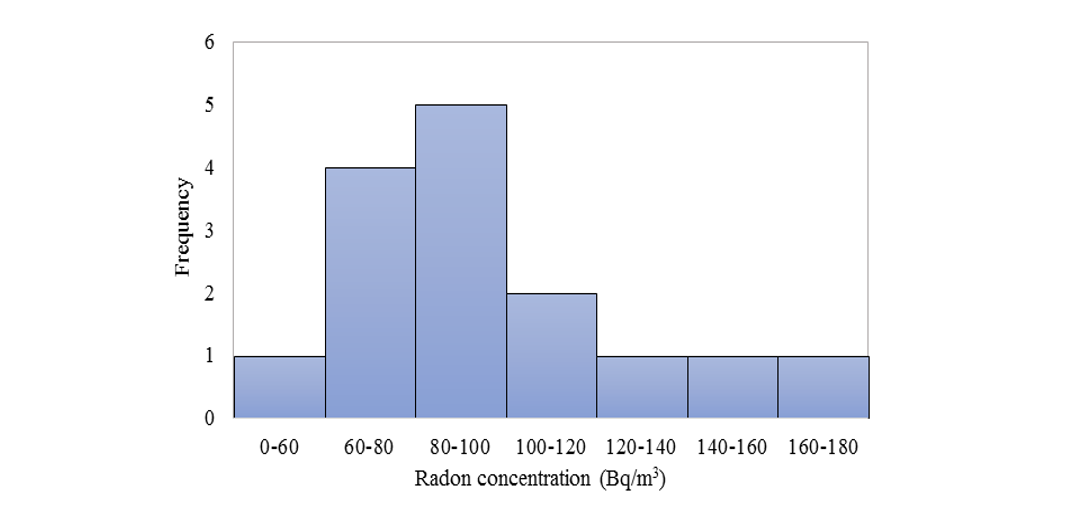
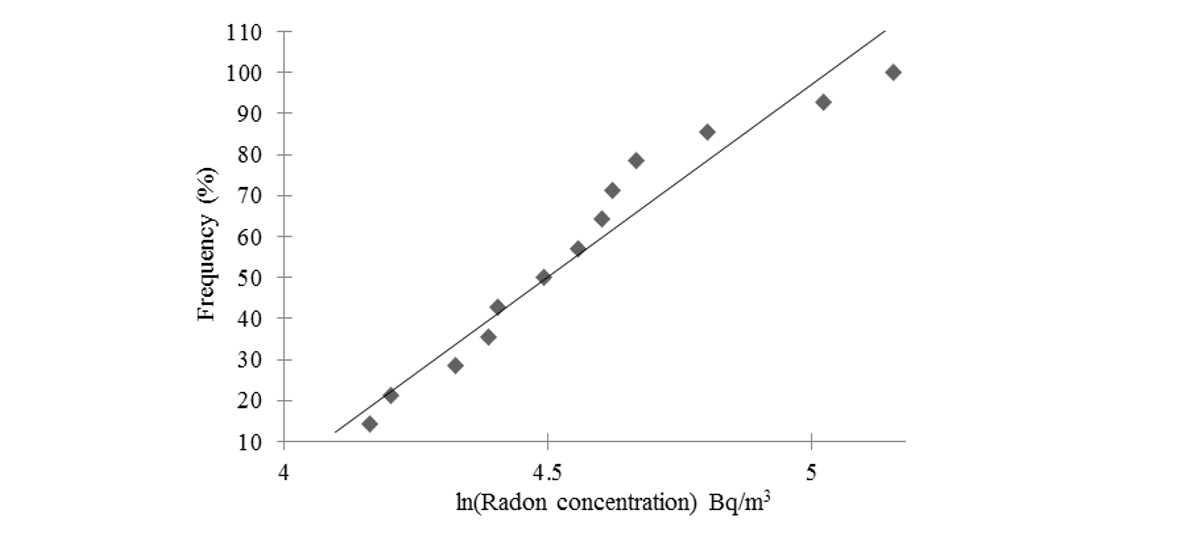
Indoor radon concentration: The indoor radon concentrations measured in the selected dwellings range from 26.3 Bq/m3 to 173.3 Bq/m3 with a mean value of 93.04 Bq/m3. The lowest value was obtained on the NN site. This concentration value was quite particular as it was obtained from the 1st floor of a good, ventilated house while all others in the study were carried out in low rise residential dwellings.
The arithmetic mean value, 93.04 Bq/m3, was higher than the world average indoor value (UNSCEAR, 2009) which is approximately 40 Bq/m3.However, it must be noticed that the value derived from our survey is closed to the arithmetic mean radon concentration,90 Bq/m3, found in Thessaloniki (Clouvas et al., 2013) and lower than the average value reported for the Province of Naples, in south Italy. However, this result must be considered with caution due to the limited number of measurements performed in Yopougon.
Inside more than 66% of the monitored houses, the radon concentration was below 100 Bq/m3, the lower value recommended by ICPR 126 (ICRP, 2010). For the remaining 34%, their concentrations do not exceed the recommended upper value (300 Bq/m3) of the derived reference level (ICRP, 2014).
The indoor radon concentration frequency distributions (Fig. 3) exhibit an approximately log-normal distribution.
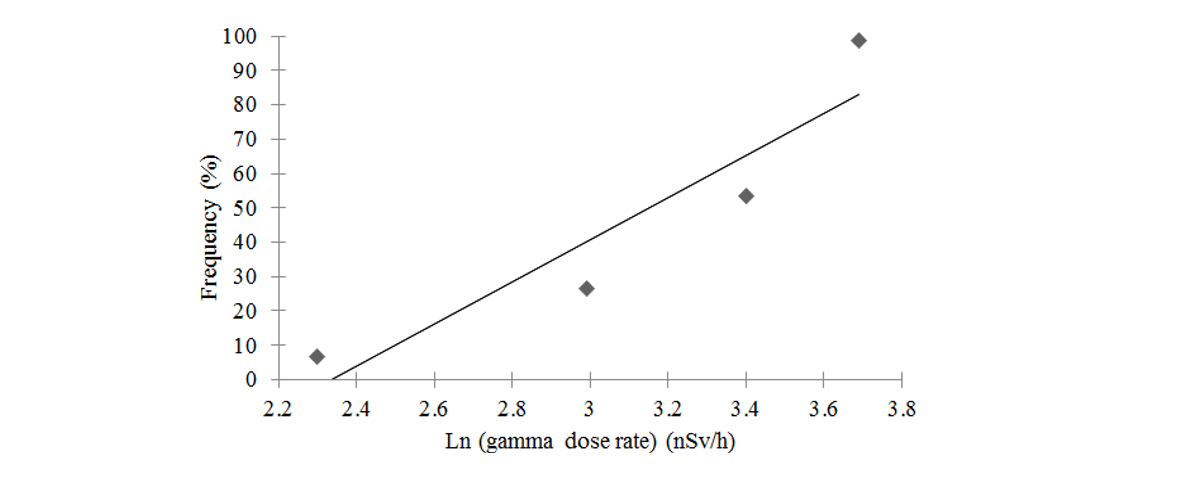
Correlation analysis: To analyze the correlation between theambient gamma dose rate and the radon concentration in the surveyed dwellings, we calculated the Pearson-Bravais coefficient. The Kolmogorov-Smirnov normality test with 95% confidence and the cumulative frequency distributions curve confirm that the two variables are normally distributed. These results are indicated in Table 2 and illustrated by Fig. 4 and 5.
Hence, one can calculate the BRAVAIS-PEARSON coefficient for the linear correlation coefficient. When all the values in Table 1 were considered to plot gamma dose rate vs radon concentration indoor (Fig. 6), we found a correlation coefficient, R = -0.28 and a corresponding coefficient of determination R2 = 0.0786. A negative linear relationship between these two variables was observed. It means that gamma dose rate and radon concentration evolve in opposite directions, contrary to what was reported by Iqbal (Iqbal et al., 2012).
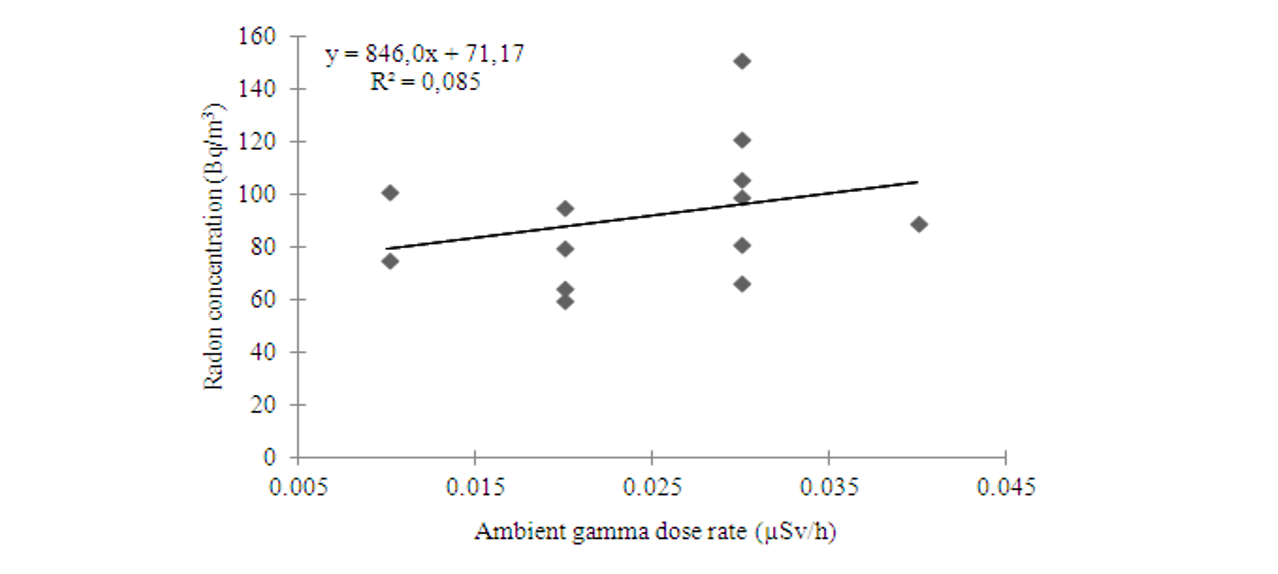
In case of rejection of the two extreme points, "NN" and "AN" respectively with abnormally very low and high concentrations, the new correlation coefficient is R = 0.29 and R2 = 0.0854 (Fig. 7). The linear correlation became positive but, it remains very weak. Such behavior was found in the study of Italy (Quarto et al., 2016). Here, only 8.54% of the variation in radon concentration was explained by the variation of the ambient gamma dose rate, as stated by the coefficient of determination R2.
In our model, we considered only one parameter (the gamma dose rate) to explain the variations in radon concentration in dwellings assuming all other things being equal. However, the radon concentration may be affected by several factors such as atmospheric conditions (wind speed, atmospheric pressure, humidity, temperature, etc.), building types, building materials, the underlying geology, etc. This approximation could explain the low value of the coefficient of determination R2.
| Variable | Observed probability (dobs) | Empirique probability (dtab) |
|---|---|---|
| Radon concentration | 0.156 | 0.338 |
| Gamma dose rate | 0.172 | 0.338 |
| dobs < dtab: The variables exhibit normal distribution behavior | ||
Conclusion
This preliminary study revealed a weak positive linear correlation between ambient gamma dose rate and radon concentration inside the surveyed houses in the commune of Yopougon. Nevertheless, it remained low (R = 0.29). About only 8.54% change in radon concentration was explained by the variation in the ambient gamma dose rate in our model (R2 = 0.085). To improve the correlation, the following factors must be considered in later studies:
- Increase the number of the monitored dwellings
- More geological data
- Characteristics of the monitored dwellings (habitat types, construction materials, ventilation, construction period, etc.)
This pilot study should be extended to the other communes of the district of Abidjan for indoor gamma dose rate mapping in the most inhabited parts of the country and later nationwide.
Acknowledgement
The authors would like to thank all those who accepted to host this survey in their rooms. They are also grateful to the Deputy Director in charge of Radiation Protection from the National Public Health Laboratory (Côte d’Ivoire) who authorized the use of the gamma survey meter for the measurements.
Author Details
1Laboratory of Nuclear Physics and Radiation Protection, Training and Research Unit-Sciences of Structures of Matter and Technology, University Félix Houphöuet-Boigny, 22 BP 582 Abidjan 22,
2Normal High School of Abidjan, 08 BP 10 Abidjan 08 (Côte d’Ivoire)
References
-
-
Agba, D.S.I., A.A. Koua, T.P.A. Dali, B.D.L.H. Gogon and G.A. Monnehan, 2015. Mesures Préliminaires de la Concentration du Radon dans le Sol l’aide de détecteurs Solides de Traces Nucléaires (DSTN-LR 115) dans la commune de Cocody. Rev. Ivoirienne Sci. Technol., 25: 1-13.
-
Clouvas, A., S. Xanthos, M. Kolovou, C. Potiriadis, G. Takoudis and J. Guilhot, 2013. Follow-up study of indoor radon in Greek buildings. Radiat. Prot. Dosimetry, 157(2): 291-297.
-
IARC, 1988. International Agency for Research on Cancer. Monographs on the Evaluation of Carcinogenic Risk to Humans: Man-made Fibres and Radon. IARC 43, Lyon.
-
ICRP, 1993. International commission on Radiological Protection. Protection against radon-222 at home and at work. ICRP Publication 65. Annales. ICRP 23(2).
-
ICRP, 2010. Lung Cancer Risk from Radon and Progeny and Statement on Radon. ICRP Publication 115, Annales. ICRP 40(1).
-
ICRP, 2014. Radiological Protection against Radon Exposure. ICRP Publication 126. Annales. ICRP 43(3).
-
Iqbal, A., M. Shahid Baig, M. Akram and A.A. Qureshi, 2012. Indoor radon concentration levels, gamma dose rates and impact of geology-A case study in Kotli, State of Azad Jammu and Kashmir, sub-Himalayas, in Pakistan. Radioprotection, 47(2): 253-270.
-
Koua, A., H. Michel, J. Alabdullah, V. Barci, H.K. Aka, G. Barci-funel and G. Ardisson, 2009a. First measurements of anthropogenic and natural radionuclides in surface soils (10 cm) of Côte d’Ivoire. Compt. Rendus de l’Academie des Sci., 12(8): 850-855.
-
Koua, A.A., M.A. Kouacou, D.K. Konan, M.C. Kouassi, B. Koffi, P.A. Dali and G. Ardisson, 2009b. Natural background radiation and dose rates measurements in surface soils in côte d’ivoire. Phys. Chem. News, 46: 85-89.
-
Kouadio, L.D., 2008. Evaluation de la radioactivité naturelle dans le district d’Abidjan: Cas de la commune d’Abobo, DEA (Master Dissertation) Matière-Modélisation-Rayonnement, Sciences et Techniques Nucléaires, UFR SSMT, Université Félix Houphouët-Boigny.
-
N’guessan, K.J.F., 2014. Impact du radon sur la santé de la population du District d’Abidjan: cas de la commune d’Abobo, Master 2 de Rayonnement-Matière-Modélisation, Sciences et Techniques Nucléaires, UFR SSMT, Université Félix Houphouët-Boigny.
-
N’guessan, K.J.F., T.P.A. nDali, A.A. Koua, B.D.L.H. Gogon, G.A. Monnehan, et al., 2016. Indoor Radon Measurement and Excess Lung Cancer Risk Evaluation in the District of Abidjan: The Case of the Commune of Abobo (Côte d’Ivoire). Int. J. Pure Appl. Sci. Technol., 32(2): 49.
-
Nonka, G.R., 2015. Impact du radon sur la santé de la population du District d’Abidjan: Cas de la commune Yopougon, Master 2 de Rayonnement-Matière-Modélisation, Sciences et Techniques Nucléaires UFR SSMT de l’Université Félix Houphouët-Boigny de Cocody.
-
Quarto, M., M. Pugliese, F. Loffredo and V. Roca, 2016. Indoor radon concentration and gamma dose rate in dwellings of the Province of Naples, South Italy, and estimation of the effective dose to the inhabitants. Radioprotection, 51(1): 31-36.
-
Sundal, A.V. and T. Strand, 2004. Indoor gamma radiation and radon concentrations in a Norwegian carbonatite area. J. Environ. Radioact., 77(2): 175-189.
-
UNSCEAR, 2000. United Scientific Committee on the Effects of Atomic Radiation. Report: Annex B: Sources and Effects of Ionizing Radiation, New York.
-
UNSCEAR, 2009. United Scientific Committee on the Effects of Atomic Radiation. Report: Annex E: Source-to-Effects Assessment for Radon in Homes and Workplaces, New York.
-
Vanié, B.T.S., 2015. Etude de la corrélation entre le débit de dose gamma et la concentration de radon à l’intérieur des maisons, Yopougon, Master 2 de Rayonnement-Matière-Modélisation, Sciences et Techniques Nucléaires UFR SSMT de l’Université Félix Houphouët-Boigny de Cocody.
-
WHO, 1986. World Health Organization. Indoor Air Quality Research: Report on a WHO Meeting, 27-31 August 1984, Stockholm, Copenhagen.
Rights and permissions
Open Access: This article is licensed under a Creative Commons Attribution 4.0 International License, which permits use, sharing, adaptation, distribution and reproduction in any medium or format, as long as you give appropriate credit to the original author(s) and the source, provide a link to the Creative Commons license, and indicate if changes were made. The images or other third-party material in this article are included in the article’s Creative Commons license, unless indicated otherwise in a credit line to the material. If material is not included in the article’s Creative Commons license and your intended use is not permitted by statutory regulation or exceeds the permitted use, you will need to obtain permission directly from the copyright holder. To view a copy of this license, visit http://creativecommons.org/licenses/by/4.0/
Cite this Article
S.T.B. Vanié, K. Djagouri, T.P.A. Dali, G.A. Monnehan and A.A. Koua, 2021. Survey of Gamma Dose Rate in Air Inside Some Dwellings of the Commune of Yopougon, Abidjan, Côte d’Ivoire. Research Journal of Applied Sciences, Engineering and Technology 18: 79-85 http://doi.org/10.19026/rjaset.18.6066
Received
Accepted
Published
14 November, 2018
27 December, 2018
25 September , 2021
DOI: http://doi.org/10.19026/rjaset.18.6066
Sections
Abstract
Keywords
Introduction
Materials And Methods
Study area
Indoor Gamma dose rates and radon measurements
Statistical analysis
Results And Discussion
Indoor gamma dose rates
Indoor radon concentration
Correlation analysis
Conclusion
Acknowledgement
Author Details
References
Rights And Permissions
Cite This Article