Atmawinata, 2001. Processing and Coffee Bean Chemical Composition: Role Taste Test in Control Coffee Quality. Coffee Research Center and Indonesian Cocoa, Jember.
Advance Journal of Food Science and Technology
Effects of Using Controlled Decafeinated Machine on Quality of Robusta Coffee Bean
Advance Journal of Food Science and Technology 2019 17: 1-6
Cite This ArticleAbstract
The objective of this research is to determine the effects of residence time during decaffeination process using ethyl acetate solvent in decaffeinated controlled machine. The residence times are 2, 4 and 6 h. Decaffeination process was divided into two steps. First step was steaming process and the second step was caffeine extraction process. The objective of steaming process was to achieve the maximum moisture content of coffee bean, so the ethyl acetate solvent could penetrate the coffee bean. The results of steaming process of Robusta coffee beans in the decaffeinated controlled machine for 4 h indicated resources that the beans and their water adsorbed moisture content Increased from 12 to 52%. At the second step, the beans experienced Darkening of color indicated resources by the decreasing value of L from coffee bean. The Lowest caffeine content of 0.3% gained from the longest residence time of decaffeination process (6 h). Decaffeinated coffee bean has the value of the organoleptic test are in the range of 2-2.5 for aroma, flavor, bitterness and body.
Keywords:
Introduction
Indonesia is considered a strategic world coffee exporter. Indonesia is one of the country's third largest coffee exporter after Brazil and Vietnam. Indonesian coffee production amounted to 11.250 tons per year is quite low when compared to coffee producing countries in the world such as Brazil (50.826 tons per year) and Vietnam (22.000 tons per year) (International Coffee Organization, 2012). Coffee is one of the potential export commodities for Indonesia. But in this modern era of human began to realize that the effect of the caffeine in coffee is thought to have adverse effects on human health. Human consciousness on the health impact on the decline of interest for coffee. According Koswara (2006) which states that consuming coffee in doses higher caffeine causes heart pounding, arteriosclerosis, liver damage, hands trembling, muscle spasms, headache, nausea and can even cause mutations in the gene.
Coffee low in caffeine is one product diversification to increase value added and domestic consumption of coffee in Indonesia. The added value obtained from the selling price low caffeine coffee relatively high in the market and the utilization of natural caffeine compounds for the food and beverage industry and the pharmaceutical industry (Widyotomo et al., 2012). Decaffeination is a process that aims to reduce the levels of caffeine in coffee. During this time, decaffeination process using imported technology both from a hardware and software. This causes the high low coffee caffeine (Widyotomo et al., 2012).
The development process decaffeination of robusta coffee beans in a reactor single column has intensively conducted by the Research Center of Indonesian Coffee and Cocoa using solvent water (Sri-Mulato et al., 2004; Lestari, 2004). The use of a single column reactor among others has a very simple design (Sri-Mulato et al., 2004). Coffee decaffeination process development must continue to be made, among which innovation decaffeination coffee making machines controlled by the construction design of appropriate use thermo control system and clock control to optimize the process decaffeination coffee. According to (Sri-Mulato et al., 2004), the higher the temperature and concentration of the solvent, the transfer process will be faster caffeine compounds. However, the higher the temperature the solvent will impact on the flavor of the coffee beans low in caffeine and any concentration of solvent has a certain character in dissolving the compound caffeine which depends on the temperature of the process. Therefore, the objective of this study was to determine the quality characteristics of coffee beans that include physical, chemical and organoleptic use the controlled decaffeinated machine.
Materials And Methods
Materials: A raw material used in this study is the coffee bean rice Robusta quality level IV with a range of water content 12-13% of which comes from the village of Sidomulyo. One cycle of fermented beans do for 5 days in shallow crates with the reversal process performed one after 48 h of fermentation process takes place. The coffee was brought to the laboratory in sacks and stored in a cool place until use within a period of less than 24 h. The chemicals used include isopropanol, water, n-propanol, CuSO4, ZnSO4, FeSO4, HCL 37%, chloroform, ethyl acetate, H2SO4 concentrated, Magnesium Oxide (MgO), a solution of Potassium Hydroxide (KOH) 0.1 N, solution of sodium hydroxide (NaOH) 0.1 N All material obtained from various chemical Jember, Jember prosperous shop, BRATACO Chemica, Biochemistry Laboratory of Agricultural Products Department of Agricultural Technology, Laboratory CDAST (Center of Advanced Science and Technology Development) Jember.
Methods: Experiments were performed by treatment with a temperature of 100°C and the long process of dissolution. Decaffeination using ethyl acetate solvent. The length of time the process of three levels, namely 2, 4 and 6 h. Then observed in the optimum condition to produce coffee beans of the highest quality.
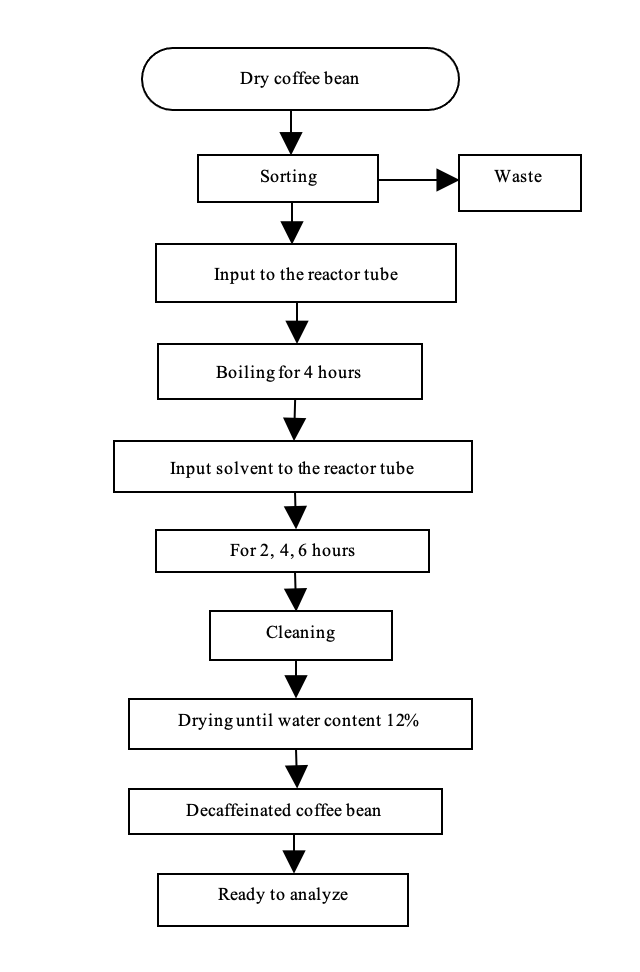
Decaffeination process (Fig. 1): Decaffeination process steps using decaffeinated controlled machine to determine the effect of temperature and solvent concentration is shown in Fig. 1. Before being fed into the reactor decaffeination coffee beans sorted to separate it from dirt and other foreign matter. Coffee beans, water and solvents that are used for each treatment each as much as 3 kg, 1.5 L and 3 L.
Decaffeination process consists of the stages of the boiling process and dissolution. The boiling process coffee beans done in the tube reactor using heat source an electric heater with a system combined with a heating jacket system thermo control to control the temperature. The water content increased from 12 to 54-57% after steaming process for 2 h for all the seed size. After the boiling process is completed, the water released from the reactor and replaced with a solvent. The solvent is heated to a temperature obtained a predetermined treatment. Solvents included in the controlled decaffeinated machine through a pipe connected to the reactor tube. Old leaching process is stopped until a predetermined treatment temperature.
Analysis physical quality coffee beans (color, moisture content and texture): Tests measured color using the color reader. Observations were made three times repeated measurements or testing to obtain more accurate results. Prior to use, Color Reader calibrated with standards. Some coffee beans are put in the cup, then the target sample at seven points to determine the value of dL, da and db. The value of L, a and b sample is determined by adding the value of dL, da and db measured by the value of L, a and b standards. Testing texture measured using penetrometer. Observations were made three times repeated measurements or testing to obtain more accurate results. A measurement of water content is done using the AOAC method.
Chemical Analysis coffee beans: Levels of caffeine, chlorogenic acid and trigonelin using HPLC (Herina, 2010)
Extraction of coffee beans carried out for 9 h using a soxhlet. Separation of compounds in coffee extractant performed by HPLC using methanol eluent: ACN = 80:20, the retention time of about 2.8 min. Standard measurement of caffeine, chlorogenic acid and trigonelin 100 ppm at a wavelength of 270 nm.
Appearance analysis (Atmawinata, 2001): Test of decaffeinated coffee taste conducted by brewing a 100 g sample of coffee powder with boiling water (100°C). After five minutes when the parts are already wetted everything coffee floating and submerged, then steeping the coffee began stirring gently. Rankings assessment test flavors of coffee for sensory aroma, flavor, body and bitterness is 0 (no), 1 (low), 2 (low-moderate), 3 (moderate), 4 (medium-high), while for the Final Appreciation (FA) is 0 (not drinkable), 1 (very poor), 2 (ugly), 3 (acceptable), 4 (good).
Results And Discussion
Analysis of quality physical coffee beans:
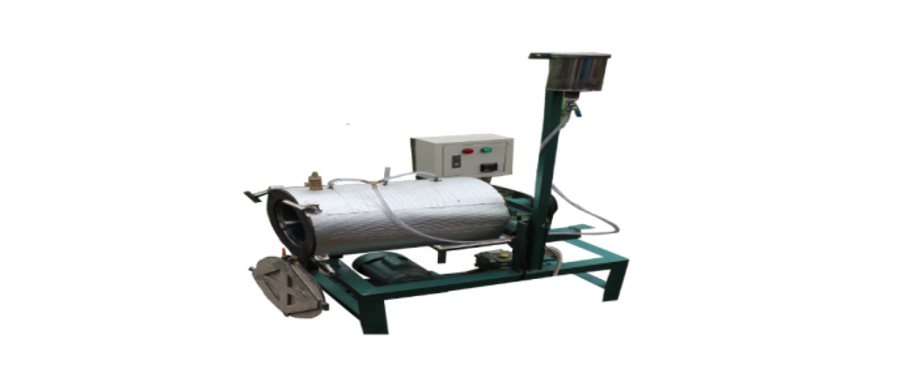
Moisture: Steaming using water at 100°C conducted for 4 h in a single column reactor which is connected to the temperature controller. This process aims to obtain development of the volume of coffee beans and water content of the maximum. The circuit is made covering the mechanism of action, namely the reactor tube cylindrical horizontal, heat sources, propulsion and transmission systems, as well as the control box temperature and rotation stirrer. Sketch tool used is displayed in Fig. 2.
Coffee beans including agricultural materials that have low thermal conductivity properties because it has a very dense cell structure. The water molecules move quickly leave the surface of the water in the form of water vapor-free, penetrating the pile and heats the surface of the beans. Heat creep into seed tissues and causes the cells to expand due to the pressure of water vapor and compounds volatile gases that exist in the cell. Seed development reached its maximum value 32-38% for all grain size after steaming lasts 3 h. Warming up does not increase the volume of seed and the seed layer surface or not to rupture.
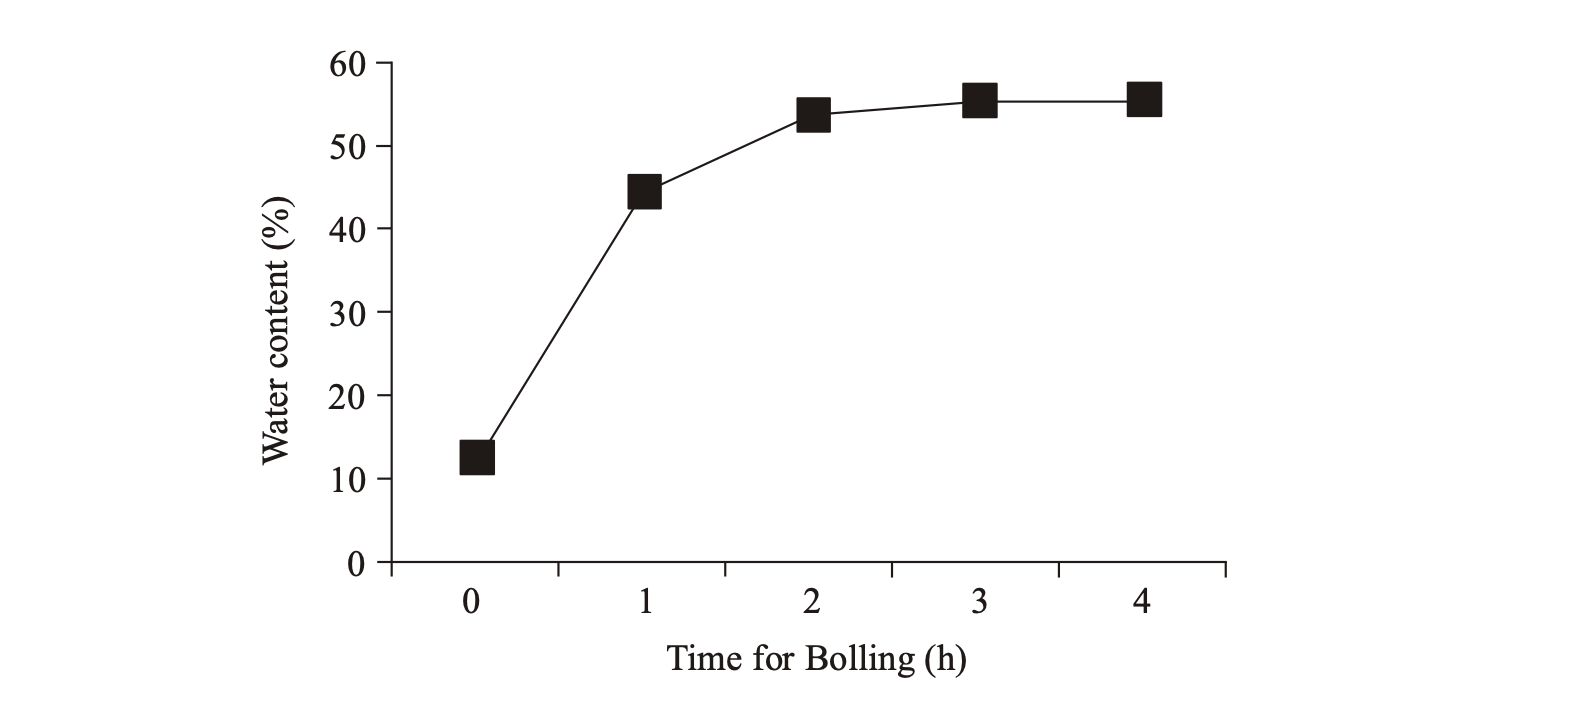
This phenomenon is related to the size and number of cells making that is in coffee beans. The presence of water inside the cell causes the cell walls are elastic and resilient so that the walls of the cell able to withstand the pressure of accumulated water vapor and gas volatile compounds in it. Increased water content aims to soften the beans and is the first step decaffeination process. Seed volume expansion causes the size of cells increase in size and lead to increased porosity between the cells to one another. The pores of coffee beans into an open network and utilized by the water molecules enter into it. High water concentration difference between the surface and inside the coffee beans cause Osmosis events. Molecules of water into the coffee bean by diffusion and then break through the cell wall in seed tissue. Water molecules trapped inside the cells so that the moisture content of the beans increased as shown in Fig. 3.
Coffee beans water levels increased after steaming process lasts for 1 h is equal to 44.6%. In last process of steaming coffee bean moisture content increased from 12.5% to 55.5%. This is almost the same as previous studies that testing of Robusta coffee decaffeination process with water for 7 h in a single column reactor shows the absorption of water by coffee beans from 12% moisture content to 67% moisture content (Purwadaria et al., 2007). In such conditions it turns out coffee beans have undergone maximum development due to additional steaming time of more than four hours did not provide additional moisture content of the beans. In this condition, the development has reached maximum volume and no more empty space that can be filled with water. Coffee beans have undergone a process of rewetting with a moisture content approaching water content when fresh coffee beans. Development of volume and an increase in water content causes the farther the distance between the cells in the coffee beans so that caffeine is expected to easily get out of the coffee beans.
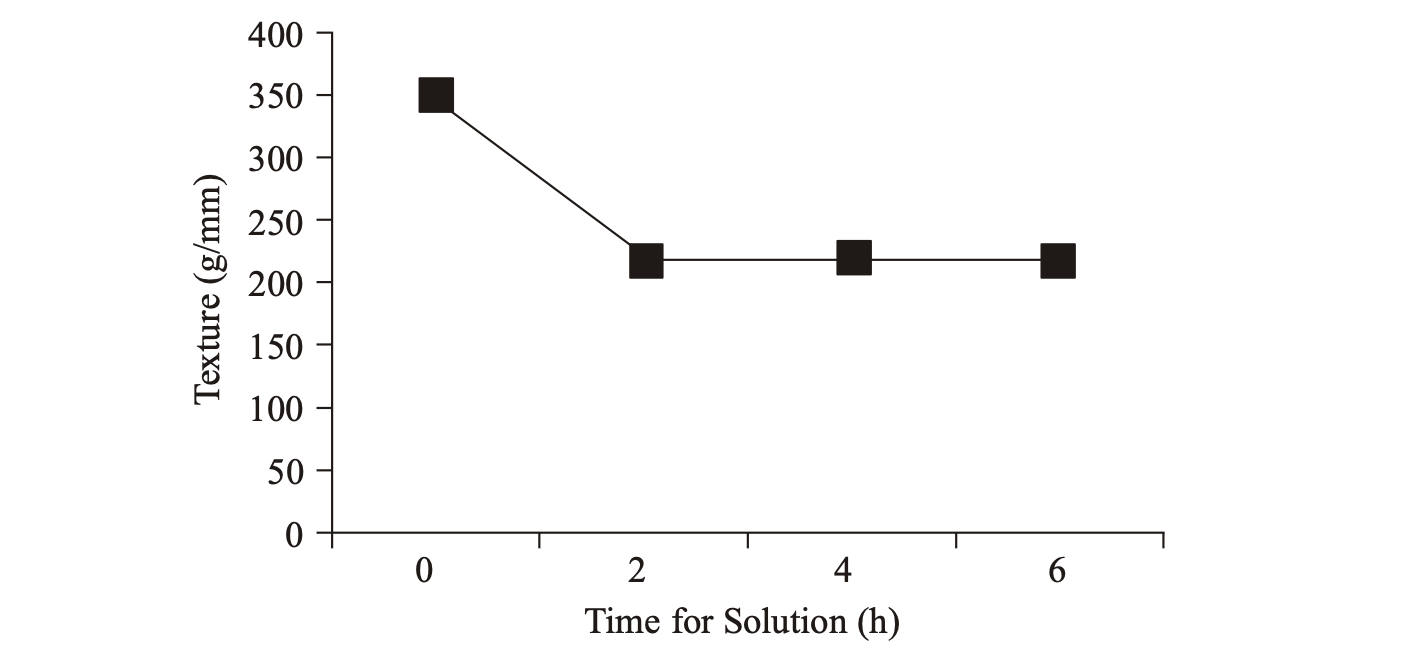
Texture: Changes the texture of the coffee beans is shown in Fig. 4. The texture at the end of the process, namely decaffeination hours to 6 amounted to 200-230 gr/mm. Decaffeination process coffee for 2-6 h causes the coffee beans to grow soft texture that is seen from the declining value of the texture of the coffee beans. This is because the pores of the surface and seed networks were dilated in the heat so that the texture of the beans are tender.
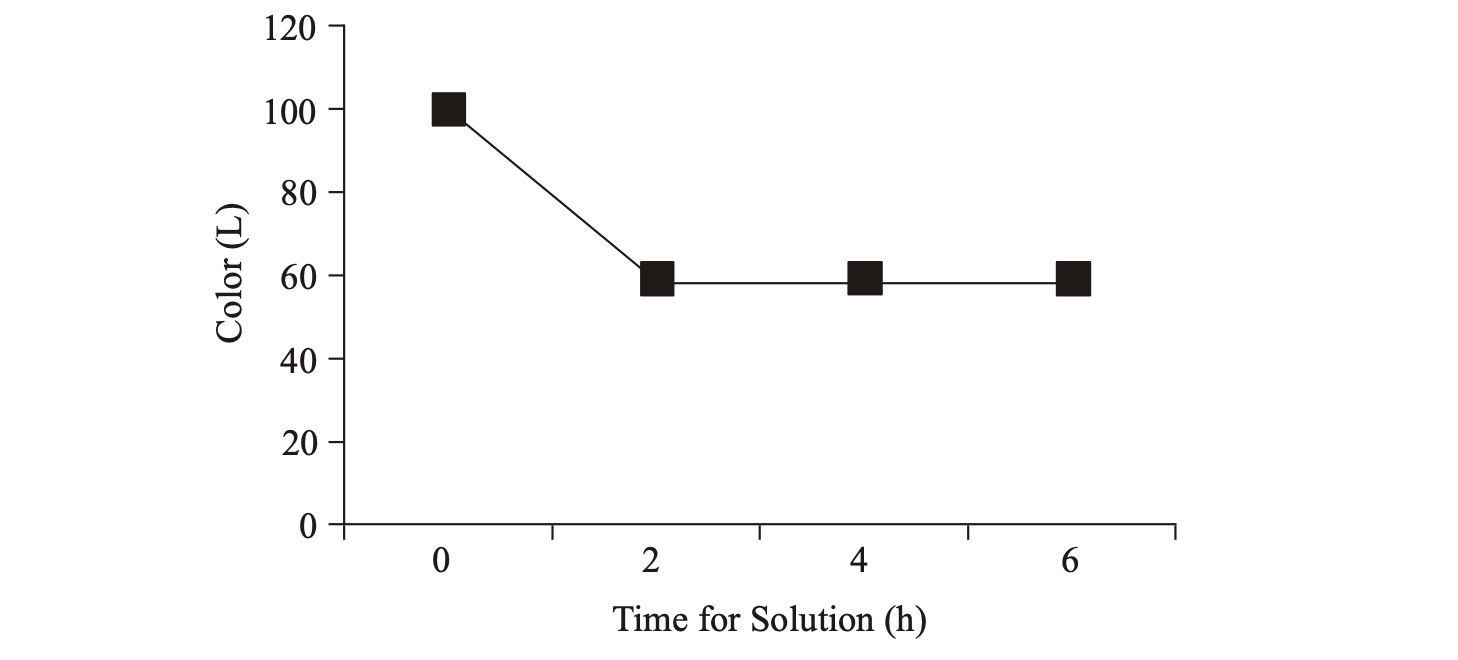
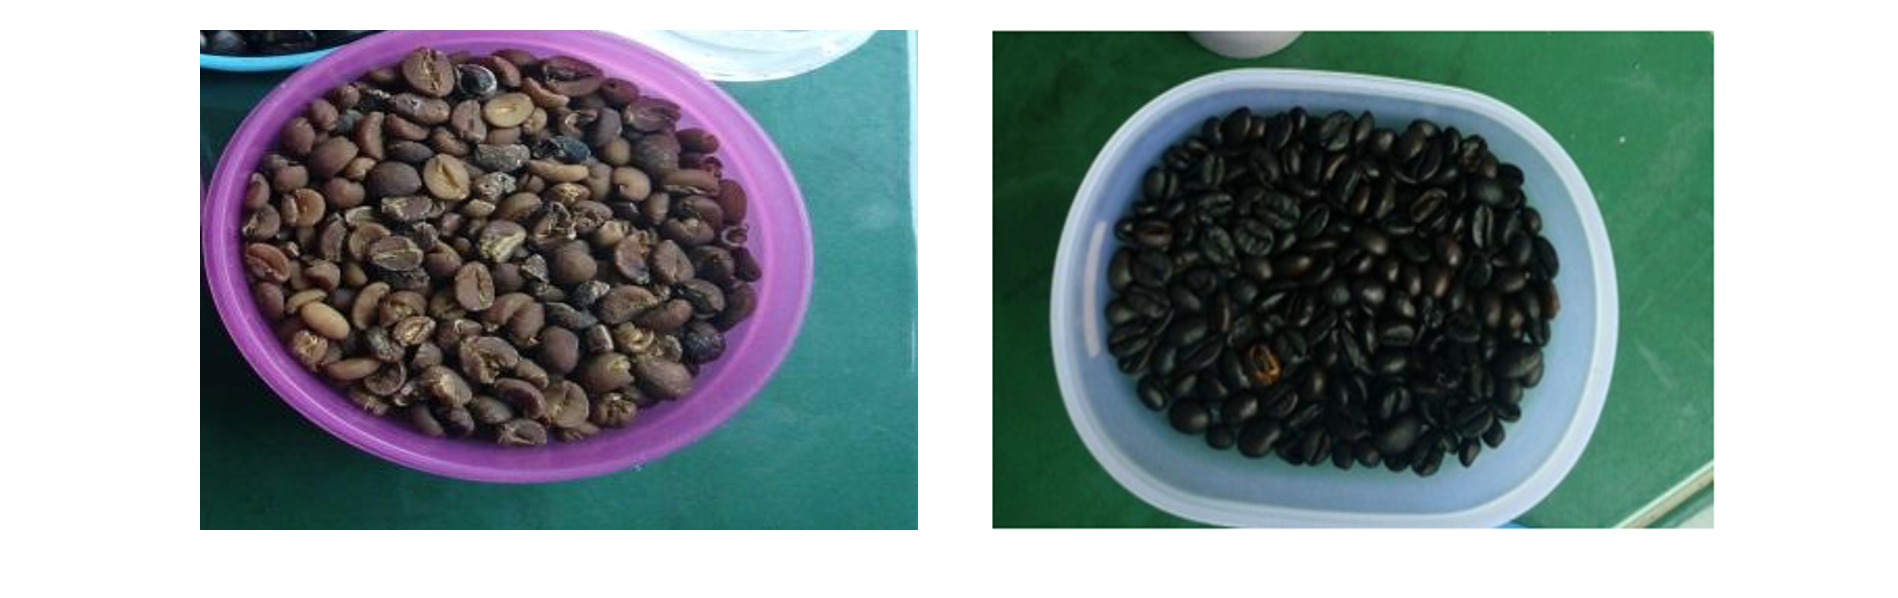
Color: Change the color of coffee beans for each long process of dissolution of caffeine shows in Fig. 5. Based on Fig. 5 shows that the color of coffee beans based on the value of L is also decreased from the original 102 to 57 at the end of the process. Figure 6 shows changing colors coffee beans after decaffeination process.
L value (lightness) is the amount of light reflected by a dark colored object when given irradiation with a light source at a particular wave. So that the darker the bean, the less reflected light (Barbara, 2000). This result same with the previous research that decaffeination process has effect darker seed color changes (Purwadaria et al., 2007). The color change (Fig. 6) is due to the Maillard reaction involving carbonyl compounds (reducing sugar) and amino acids. Maillard reaction is non-enzymatic browning reactions that produce complex compounds with high molecular weight (Winarno, 1997).
Chemical Analysis coffee beans (caffeine, chlorogenic acid and trigonellin): The decaffeination coffee bean dried to moisture content until 12-13% using sunlight and continued with oven dryers. Results of analysis of the levels of caffeine, chlorogenic acid and trigonellin can be seen in Table 1 below.
Lowest levels of caffeine reached on a long process of decaffeination 6 h, is 0.3%. The positions of caffeine in coffee beans are located on the cell wall and cytoplasm. Caffeine present in the cytoplasm are in the free state, while the rest found in the cell walls under conditions of bonded as alkaloid compound in the form of potassium complex salt compound chlorogenic an ionic bond (Sivetz and Desroiser, 2003). Bonding complex cause’s caffeine cannot move freely within the network of coffee beans. Effect of heat energy can cause these bonds disconnected so caffeine readily soluble in solvents ethyl acetate. Physical changes during steaming coffee beans (volume expansion) are the first step in the process of softening network of coffee beans and far spacing between cells. Making it easier for ethyl acetate as the solvent molecules diffuse into the beans and caffeine compounds accelerating dissolution. The smaller the size of coffee beans, then the distance between the surfaces of the seeds to the core seeds will become shorter so that the solvent molecules will more quickly diffuse and reach the cell wall and cytoplasm, so the more the amount of caffeine dissolved.
Dissolving the compound caffeine from coffee beans preceded by the breaking of ties complex compound due to heat treatment. In such conditions, caffeine become more mobile, easily diffuse through the cell wall and subsequently dissolved in ethyl acetate solvent. The results showed that the smaller the size of the beans and the longer the process of dissolving and leaching the higher the temperature, the rate of decline of the caffeine in the coffee beans will be higher. This is consistent with what has been reported by Jaganyi and Price (1999) that the result of condensation is influenced by the old process, the concentration of the solvent and the size of the material.
On the table above shows that changes in the levels of chlorogenic acid and trigonelin greatest in a long time of dissolution 6 h are consecutive of 2.1% for chlorogenic acid and 0.4% for trigonellin. Coffee beans using a controlled decaffeinated machine still have high bioactive compounds that is chlorogenic acid. However, the resulting flavor is low. This is indicated by low levels of trigonellin generated. To obtain optimum flavor, trigonelin levels contained in the coffee beans must be greater than 1% (Viani and Hotman, 1974).
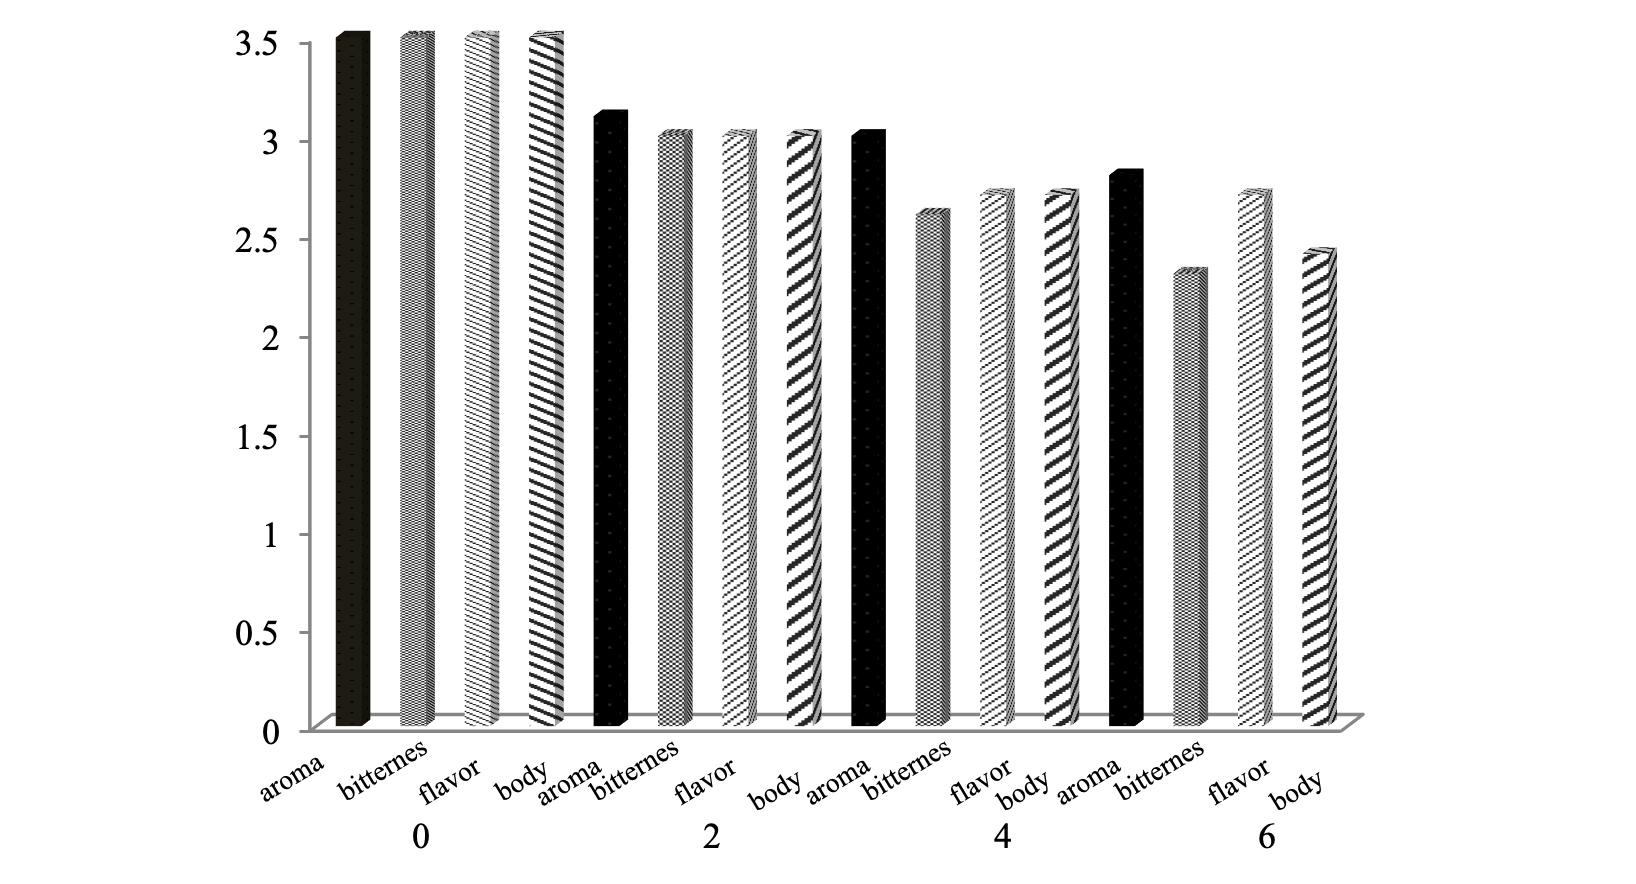
Analysis of appearance: Decaffeinated coffee beans results that have been dried to a moisture content reaches 12-13%, then roasted on 185-190°C temperature for 7 min. After that milled (grinding) to produce coffee powder, then brewed and conducted organoleptic (taste). The coffee will have a high economic value if it can give pleasure and satisfaction to consumers of flavors produced. A value consisting of coffee flavor aroma, flavor, body and bitterness is a unity that determines the quality of coffee products. Figure 7 displays the value of steeping coffee flavor results from the treatment decaffeination process long dissolution.
Aroma obtained from the evaporation of volatile compounds from steeping the coffee aroma captured by the sensor on the sense of smell. The results showed that the resulting aroma of coffee products decaffeination will decrease (lower) with the length of dissolution. Lowest score aroma is 2.8. High acidity in coffee beans will also affect the quality of better flavor because of the presence of compounds that are volatile acids, such as formic acid, acetic acid, propanoic acid and the acid hexanoat. Volatile compounds that affect the aroma of roasted coffee formed by the Maillard reaction or the reaction of browning non-enzymatic degradation of free amino acids, degradation trigonellin, degradation of sugar and acid degradation phenolic.
Flavor is a combination between aroma captured by the sense of human olfaction and taste steeping arrested by the sense of taste. Steeping flavor associated with non-volatile compounds are dissolved, while the aroma associated with volatile compounds. The results showed that the resulting flavor of coffee products decaffeination will decrease (lower) with the length of the leaching process, which is at 2.7.
Caffeine affects the taste of coffee brewed especially bitterness. The bitterness of the coffee brew even more visible in the womb pholifenol with increasing temperature. Bitterness is a very specific sense primer received by the sense of taste (tongue). Value sensory bitterness tends to decrease because the longer the dissolution process is affected by caffeine levels.
The results showed that the bitterness resulting from decaffeinated coffee products will decrease with the smaller size of the beans, the more lengthy process of dissolution and the higher the temperature of dissolution. The result showed the lowest value for the bitterness of coffee beans at 2.3.
The body is the viscosity of steeping coffee as an internal character which can be assessed by rubbing the tongue to the palate, so there is a strong impression of steeping. Caffeine contributes to the body of the cup of coffee. This can be harmonized with the caffeine content of coffee powder which is getting down will affect the value of the lower body. The results showed that the body resulting from decaffeinated coffee products will decrease with the length of the dissolution process that is equal to 2.4. Coffee organoleptic value steeping decaffeination process results still low, ranging between 2-2.7 on a 0-4 scale well for aroma, flavor, bitterness and body, compared with the organoleptic value (standard) coffee drinks, namely 3.5 good for aroma, flavor, bitterness and body in the same scale.
| Before decaffeination | After decaffeination | |||||||||||||
|---|---|---|---|---|---|---|---|---|---|---|---|---|---|---|
| Caffeine (%) | Chlorogenic acid (%) | Trigonellin (%) | ||||||||||||
| Duration of decaffeination (h) | Duration of decaffeination (h) | Duration of decaffeination (h) | ||||||||||||
| Caffeine (%) | Chlorogenic acid (%) | Trigonellin (%) | 0 | 2 | 4 | 6 | 0 | 2 | 4 | 6 | 0 | 2 | 4 | 6 |
| 2.3 | 7.8 | 1.8 | 2.3 | 0.9 | 0.6 | 0.3 | 7.8 | 5.1 | 3.7 | 2.1 | 1.8 | 1.1 | 0.8 | 0.4 |
Conclusion
Innovation controlled decaffeinated machine by the construction design of appropriate use thermo control system and clock control to optimize the process decaffeination coffee. Coffee bean that produced by this machine have good chemical content such as high chlorogenic acid and low caffeine until 0.3%
Acknowledgement
We would like to thanks to Islamic Development Bank that give scholarship join with the Prefectural University of Hiroshima especially Faculty of Life and Environmental Science.
Author Details
1Faculty of Agriculture and Technology, University of Jember, Indonesia
2Faculty of Life and Environmental Science, Prefectural University of Hiroshima, Japan
References
Barbara, S., 2000. Introductory Food. Prentice Hall, New Jersey, USA.
Herina, A., 2010. Analysis of separation of chlorogenic acid, caffeine and ascorbic acid and skin in green coffee beans with HPLC. Seminar Thesis, ITB, Bandung.
International Coffee Organization, 2012. All Exporting Countries Total Production Crop Years. International Coffee Organization, England.
Jaganyi, D. and R.D. Price, 1999. Kinetics of tea infusion: The effect of the manufacturing process on the rate of extraction of caffeine. Food Chem., 64 (1): 27-31.
Koswara, 2006. Food Processing. Pradnya Paramita, Jakarta.
Lestari, H., 2004. Dekafeinasi coffee beans (Coffeacanephora) robusta varieties with steaming-dilution system. Thesis, Gadjah Mada University, Yogyakarta.
Purwadaria, H.K., A.M. Syarief and S. Mulato, 2007. Coffee decafeination in single column reactors with termeral solutions from cocoa pulp. IPB, Bogor.
Sivetz, M. and N.W. Desroiser, 2003. Coffee technology. The AVI Publishing Company Inc., Wesport, Connecticut, USA.
Sri-Mulato, S. Widyotomo and H. Lestari, 2004. Dissolution caffeine robusta coffee beans with fixed column using water-soluble. Pelita Plantat., 20: 97-109.
Viani, R. and I. Hotman, 1974. Thermal behavior of trigonellin. J. Food. Sci., 39(6): 1216-1217.
Widyotomo, S, Sri-Mulato, H.K. Purwadaria and A.M. Syarief, 2012. Decafeination process characteristics of robusta coffee in single-column reactor with the solvent ethyl acetate. Pelita Plantat., 25(3): 101-125.
Winarno, F.G., 1997. Food Chemistry and Nutrition. Publisher PT Gramedia Pustaka Utama, Jakarta.
Rights and permissions
Open Access: This article is licensed under a Creative Commons Attribution 4.0 International License, which permits use, sharing, adaptation, distribution and reproduction in any medium or format, as long as you give appropriate credit to the original author(s) and the source, provide a link to the Creative Commons license, and indicate if changes were made. The images or other third-party material in this article are included in the article’s Creative Commons license, unless indicated otherwise in a credit line to the material. If material is not included in the article’s Creative Commons license and your intended use is not permitted by statutory regulation or exceeds the permitted use, you will need to obtain permission directly from the copyright holder. To view a copy of this license, visit http://creativecommons.org/licenses/by/4.0/
Cite this Article
Asmak Afriliana, Tri Angga Maulana, Aly M. Firdaus, Bagas Rizcy Aldiano, Achmad Subagio and Hiroyuki Harada, 2019. Effects of Using Controlled Decafeinated Machine on Quality of Robusta Coffee Bean. Advance Journal of Food Science and Technology 17: 1-6 http://doi.org/10.19026/ajfst.17.5983
Received
Accepted
Published
May 24, 2018
October 11, 2018
January 25, 2019
DOI: http://doi.org/10.19026/ajfst.17.5983
Sections
Abstract
Keywords
Introduction
Materials And Methods
Materials
Methods
Decaffeination process
Analysis physical quality coffee beans (color, moisture content and texture)
Chemical Analysis coffee beans
Appearance analysis
Results And Discussion
Analysis of quality physical coffee beans
Texture
Color
Chemical Analysis coffee beans (caffeine, chlorogenic acid and trigonellin)
Analysis of appearance
Conclusion
Acknowledgement
Author Details
References
Rights And Permissions
Cite This Article
Authors
- Asmak Afriliana
- Tri Angga Maulana
- Aly M. Firdaus
- Bagas Rizcy Aldiano
- Achmad Subagio
- Hiroyuki Harada